
|
Concord Biotech Limited (Concordbio.ns) تقييم DCF |
Fully Editable: Tailor To Your Needs In Excel Or Sheets
Professional Design: Trusted, Industry-Standard Templates
Investor-Approved Valuation Models
MAC/PC Compatible, Fully Unlocked
No Expertise Is Needed; Easy To Follow
Concord Biotech Limited (CONCORDBIO.NS) Bundle
تحسين كفاءتك وزيادة الدقة مع حاسبة (concordbions) DCF! مزودًا ببيانات حقيقية من افتراضات Concord Biotech Limited و Visualivable ، تمكنك هذه الأداة من التنبؤ وتحليل وتقييم (Concordbions) تمامًا مثل المستثمر المخضرم.
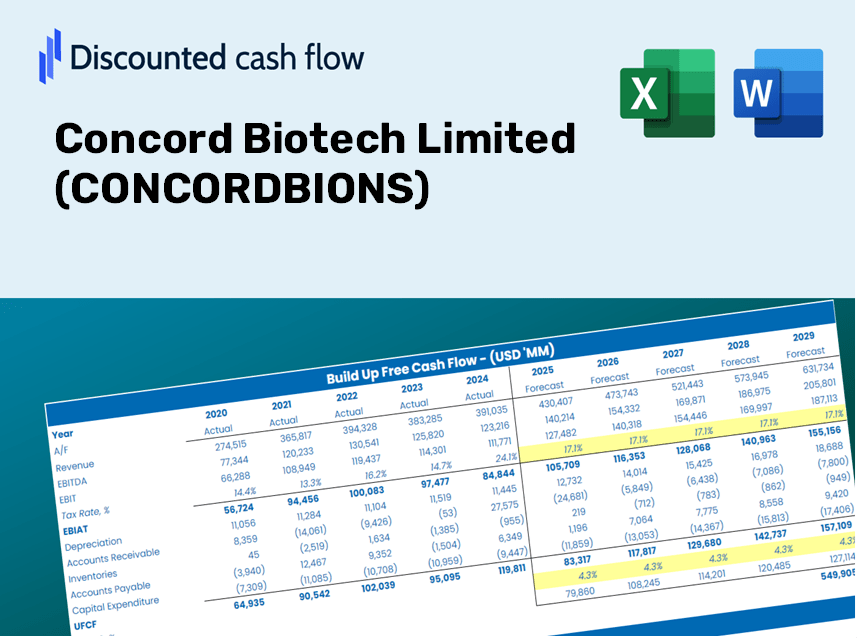
Discounted Cash Flow (DCF) - (USD MM)
| Year | AY1 2021 |
AY2 2022 |
AY3 2023 |
AY4 2024 |
AY5 2025 |
FY1 2026 |
FY2 2027 |
FY3 2028 |
FY4 2029 |
FY5 2030 |
|---|---|---|---|---|---|---|---|---|---|---|
| Revenue | 6,169.4 | 7,129.3 | 8,531.7 | 10,169.4 | 12,000.9 | 14,174.1 | 16,740.8 | 19,772.3 | 23,352.8 | 27,581.7 |
| Revenue Growth, % | 0 | 15.56 | 19.67 | 19.2 | 18.01 | 18.11 | 18.11 | 18.11 | 18.11 | 18.11 |
| EBITDA | 3,287.1 | 2,778.2 | 3,526.5 | 4,385.8 | 5,127.1 | 6,220.5 | 7,347.0 | 8,677.4 | 10,248.8 | 12,104.7 |
| EBITDA, % | 53.28 | 38.97 | 41.33 | 43.13 | 42.72 | 43.89 | 43.89 | 43.89 | 43.89 | 43.89 |
| Depreciation | 263.3 | 488.0 | 527.9 | 518.5 | 526.1 | 759.2 | 896.7 | 1,059.1 | 1,250.8 | 1,477.3 |
| Depreciation, % | 4.27 | 6.84 | 6.19 | 5.1 | 4.38 | 5.36 | 5.36 | 5.36 | 5.36 | 5.36 |
| EBIT | 3,023.8 | 2,290.2 | 2,998.7 | 3,867.3 | 4,601.0 | 5,461.3 | 6,450.3 | 7,618.3 | 8,997.9 | 10,627.3 |
| EBIT, % | 49.01 | 32.12 | 35.15 | 38.03 | 38.34 | 38.53 | 38.53 | 38.53 | 38.53 | 38.53 |
| Total Cash | 2,012.1 | 1,617.8 | 1,811.2 | 2,855.3 | 3,177.3 | 3,716.1 | 4,389.0 | 5,183.8 | 6,122.5 | 7,231.2 |
| Total Cash, percent | .0 | .0 | .0 | .0 | .0 | .0 | .0 | .0 | .0 | .0 |
| Account Receivables | 2,134.1 | 2,595.2 | 3,129.2 | 3,496.1 | 5,216.5 | 5,259.1 | 6,211.4 | 7,336.2 | 8,664.7 | 10,233.8 |
| Account Receivables, % | 34.59 | 36.4 | 36.68 | 34.38 | 43.47 | 37.1 | 37.1 | 37.1 | 37.1 | 37.1 |
| Inventories | 1,536.1 | 1,951.2 | 2,123.2 | 2,079.5 | 2,396.7 | 3,332.9 | 3,936.5 | 4,649.3 | 5,491.3 | 6,485.7 |
| Inventories, % | 24.9 | 27.37 | 24.89 | 20.45 | 19.97 | 23.51 | 23.51 | 23.51 | 23.51 | 23.51 |
| Accounts Payable | 464.0 | 831.1 | 938.0 | 944.4 | 1,130.4 | 1,385.6 | 1,636.5 | 1,932.8 | 2,282.8 | 2,696.2 |
| Accounts Payable, % | 7.52 | 11.66 | 10.99 | 9.29 | 9.42 | 9.78 | 9.78 | 9.78 | 9.78 | 9.78 |
| Capital Expenditure | -2,041.8 | -1,555.1 | -1,450.8 | -856.9 | -1,111.7 | -2,540.0 | -3,000.0 | -3,543.3 | -4,184.9 | -4,942.7 |
| Capital Expenditure, % | -33.09 | -21.81 | -17.01 | -8.43 | -9.26 | -17.92 | -17.92 | -17.92 | -17.92 | -17.92 |
| Tax Rate, % | 24.85 | 24.85 | 24.85 | 24.85 | 24.85 | 24.85 | 24.85 | 24.85 | 24.85 | 24.85 |
| EBITAT | 2,271.2 | 1,686.7 | 2,235.7 | 2,888.1 | 3,457.5 | 4,075.7 | 4,813.8 | 5,685.5 | 6,715.1 | 7,931.1 |
| Depreciation | ||||||||||
| Changes in Account Receivables | ||||||||||
| Changes in Inventories | ||||||||||
| Changes in Accounts Payable | ||||||||||
| Capital Expenditure | ||||||||||
| UFCF | -2,713.5 | 110.5 | 713.7 | 2,232.8 | 1,020.4 | 1,571.2 | 1,405.5 | 1,660.0 | 1,960.6 | 2,315.6 |
| WACC, % | 7.14 | 7.14 | 7.14 | 7.14 | 7.14 | 7.14 | 7.14 | 7.14 | 7.14 | 7.14 |
| PV UFCF | ||||||||||
| SUM PV UFCF | 7,169.1 | |||||||||
| Long Term Growth Rate, % | 2.00 | |||||||||
| Free cash flow (T + 1) | 2,362 | |||||||||
| Terminal Value | 45,967 | |||||||||
| Present Terminal Value | 32,563 | |||||||||
| Enterprise Value | 39,732 | |||||||||
| Net Debt | 18 | |||||||||
| Equity Value | 39,714 | |||||||||
| Diluted Shares Outstanding, MM | 105 | |||||||||
| Equity Value Per Share | 379.62 |
ما ستناله
- بيانات مالية دقيقة: تم تحميلها مسبقًا بأرقام Concord Biotech التاريخية والمتوقعة لتحليلها بالتفصيل.
- قالب قابل للتخصيص: قم بتعديل المدخلات الأساسية بسهولة مثل نمو الإيرادات و WACC و EBITDA٪.
- الحسابات الفورية: لاحظ القيمة الجوهرية لتحديث Concord Biotech في الوقت الفعلي أثناء إجراء التغييرات.
- أداة تقييم الخبراء: مصمم خصيصًا للمستثمرين والمحللين والاستشاريين بهدف تحقيق نتائج DCF دقيقة.
- التصميم البديهي: تخطيط واضح وتعليمات مباشرة مناسبة لجميع مستويات الخبرة.
الميزات الرئيسية
- مدخلات مالية قابلة للتخصيص: اضبط المعلمات الأساسية مثل نمو الإيرادات ، EBITDA ٪ ، والنفقات الرأسمالية.
- تقييم DCF الفوري: يحسب تلقائيًا القيمة الجوهرية ، NPV ، والمقاييس المالية الإضافية.
- دقة عالية الدقة: يعزز بيانات كونكورد Biotech Limited (ConcordBions) البيانات المالية الفعلية لنتائج التقييم الموثوقة.
- تحليل سيناريو مبسط: تقييم دون جهد الافتراضات وتحليل آثارها.
- زيادة الكفاءة: وفر الوقت عن طريق تجنب الحاجة إلى إنشاء نماذج تقييم معقدة من الألف إلى الياء.
كيف تعمل
- الخطوة 1: قم بتنزيل ملف Excel لـ Concord Biotech Limited (ConcordBions).
- الخطوة 2: راجع البيانات المالية المملوءة مسبقًا وتوقعات Concord Biotech.
- الخطوة 3: ضبط المدخلات الرئيسية مثل نمو الإيرادات ، WACC ، ومعدلات الضرائب (الخلايا المميزة).
- الخطوة 4: راقب تحديث نموذج DCF في الوقت الفعلي أثناء تغيير افتراضاتك.
- الخطوة 5: تحليل النتائج واستخدم رؤى قرارات الاستثمار الخاصة بك.
لماذا تختار هذه الآلة الحاسبة؟
- واجهة سهلة الاستخدام: مصمم لكل من المبتدئين والمهنيين المتمرسين.
- مدخلات قابلة للتخصيص: تعديل المعلمات بسهولة لتناسب احتياجات التحليل الخاصة بك.
- ردود الفعل في الوقت الحقيقي: راقب التحديثات الفورية لتقييم Concord Biotech Limited (ConcordBions) أثناء تعديل المدخلات.
- البيانات المحملة مسبقًا: يأتي مزودًا بالمعلومات المالية الفعلية لـ Concord Biotech Limited (ConcordBions) للتقييمات السريعة.
- اعتمد عليه الخبراء: يعمل من قبل المستثمرين والمحللين لاتخاذ خيارات مستنيرة.
من يجب أن يفكر في استخدام Concord Biotech Limited (Concordbions)؟
- المستثمرون الأفراد: اتخاذ خيارات متعلمة فيما يتعلق بشراء أو بيع الأسهم في Concord Biotech.
- المحللون الماليون: قم بتحسين عمليات التقييم الخاصة بك مع نماذج مالية متوفرة بسهولة مصممة لتكنولوجيا Concord Biotech.
- الاستشاريون: تزويد العملاء برؤى تقييم دقيقة وفعالة تتعلق بالتكنولوجيا الحيوية كونكورد.
- أصحاب الأعمال: احصل على منظور حول كيفية تقدير شركات التكنولوجيا الحيوية الرئيسية مثل Concord Biotech لإبلاغ استراتيجيات عملك الخاصة.
- طلاب التمويل: استكشاف تقنيات التقييم من خلال عدسة بيانات وسيناريوهات العالم الحقيقي من Concord Biotech.
ما يحتويه القالب
- البيانات التاريخية: تضم Concord Biotech Limited (Concordbions) الأداء المالي والتنبؤ الأساسي.
- نماذج DCF و Ruvered DCF: قوالب شاملة لحساب القيمة الجوهرية لـ Concord Biotech Limited (concordbions).
- ورقة WACC: حسابات تم إنشاؤها مسبقًا لمتوسط تكلفة رأس المال المرجح.
- مدخلات قابلة للتحرير: اضبط المعلمات الرئيسية مثل معدلات النمو ونسب EBITDA وافتراضات Capex.
- البيانات الفصلية والسنوية: تحليل شامل للبيانات المالية لـ Concord Biotech Limited (ConcordBions).
- لوحة القيادة التفاعلية: تصور ديناميكي نتائج التقييم والتوقعات.
Disclaimer
All information, articles, and product details provided on this website are for general informational and educational purposes only. We do not claim any ownership over, nor do we intend to infringe upon, any trademarks, copyrights, logos, brand names, or other intellectual property mentioned or depicted on this site. Such intellectual property remains the property of its respective owners, and any references here are made solely for identification or informational purposes, without implying any affiliation, endorsement, or partnership.
We make no representations or warranties, express or implied, regarding the accuracy, completeness, or suitability of any content or products presented. Nothing on this website should be construed as legal, tax, investment, financial, medical, or other professional advice. In addition, no part of this site—including articles or product references—constitutes a solicitation, recommendation, endorsement, advertisement, or offer to buy or sell any securities, franchises, or other financial instruments, particularly in jurisdictions where such activity would be unlawful.
All content is of a general nature and may not address the specific circumstances of any individual or entity. It is not a substitute for professional advice or services. Any actions you take based on the information provided here are strictly at your own risk. You accept full responsibility for any decisions or outcomes arising from your use of this website and agree to release us from any liability in connection with your use of, or reliance upon, the content or products found herein.