
|
Avaliação DCF da Concord Biotech Limited (Concordbio.NS) |
Totalmente Editável: Adapte-Se Às Suas Necessidades No Excel Ou Planilhas
Design Profissional: Modelos Confiáveis E Padrão Da Indústria
Pré-Construídos Para Uso Rápido E Eficiente
Compatível com MAC/PC, totalmente desbloqueado
Não É Necessária Experiência; Fácil De Seguir
Concord Biotech Limited (CONCORDBIO.NS) Bundle
Otimize sua eficiência e aumente a precisão com a nossa calculadora DCF (Concordbions)! Equipado com dados reais da Concord Biotech Limited e suposições personalizáveis, essa ferramenta permite que você preveja, analise e avalie (Concordbions), assim como um investidor experiente.
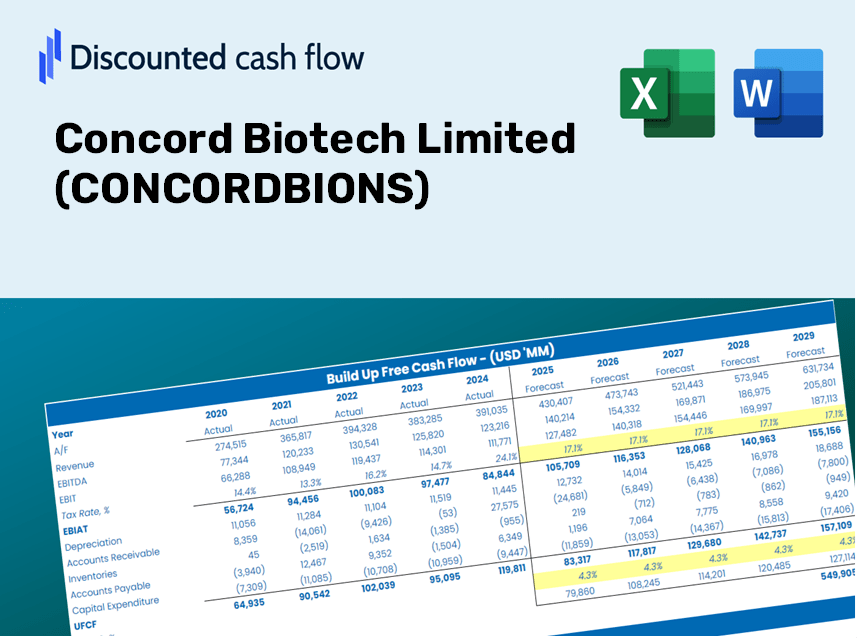
Discounted Cash Flow (DCF) - (USD MM)
| Year | AY1 2021 |
AY2 2022 |
AY3 2023 |
AY4 2024 |
AY5 2025 |
FY1 2026 |
FY2 2027 |
FY3 2028 |
FY4 2029 |
FY5 2030 |
|---|---|---|---|---|---|---|---|---|---|---|
| Revenue | 6,169.4 | 7,129.3 | 8,531.7 | 10,169.4 | 12,000.9 | 14,174.1 | 16,740.8 | 19,772.3 | 23,352.8 | 27,581.7 |
| Revenue Growth, % | 0 | 15.56 | 19.67 | 19.2 | 18.01 | 18.11 | 18.11 | 18.11 | 18.11 | 18.11 |
| EBITDA | 3,287.1 | 2,778.2 | 3,526.5 | 4,385.8 | 5,127.1 | 6,220.5 | 7,347.0 | 8,677.4 | 10,248.8 | 12,104.7 |
| EBITDA, % | 53.28 | 38.97 | 41.33 | 43.13 | 42.72 | 43.89 | 43.89 | 43.89 | 43.89 | 43.89 |
| Depreciation | 263.3 | 488.0 | 527.9 | 518.5 | 526.1 | 759.2 | 896.7 | 1,059.1 | 1,250.8 | 1,477.3 |
| Depreciation, % | 4.27 | 6.84 | 6.19 | 5.1 | 4.38 | 5.36 | 5.36 | 5.36 | 5.36 | 5.36 |
| EBIT | 3,023.8 | 2,290.2 | 2,998.7 | 3,867.3 | 4,601.0 | 5,461.3 | 6,450.3 | 7,618.3 | 8,997.9 | 10,627.3 |
| EBIT, % | 49.01 | 32.12 | 35.15 | 38.03 | 38.34 | 38.53 | 38.53 | 38.53 | 38.53 | 38.53 |
| Total Cash | 2,012.1 | 1,617.8 | 1,811.2 | 2,855.3 | 3,177.3 | 3,716.1 | 4,389.0 | 5,183.8 | 6,122.5 | 7,231.2 |
| Total Cash, percent | .0 | .0 | .0 | .0 | .0 | .0 | .0 | .0 | .0 | .0 |
| Account Receivables | 2,134.1 | 2,595.2 | 3,129.2 | 3,496.1 | 5,216.5 | 5,259.1 | 6,211.4 | 7,336.2 | 8,664.7 | 10,233.8 |
| Account Receivables, % | 34.59 | 36.4 | 36.68 | 34.38 | 43.47 | 37.1 | 37.1 | 37.1 | 37.1 | 37.1 |
| Inventories | 1,536.1 | 1,951.2 | 2,123.2 | 2,079.5 | 2,396.7 | 3,332.9 | 3,936.5 | 4,649.3 | 5,491.3 | 6,485.7 |
| Inventories, % | 24.9 | 27.37 | 24.89 | 20.45 | 19.97 | 23.51 | 23.51 | 23.51 | 23.51 | 23.51 |
| Accounts Payable | 464.0 | 831.1 | 938.0 | 944.4 | 1,130.4 | 1,385.6 | 1,636.5 | 1,932.8 | 2,282.8 | 2,696.2 |
| Accounts Payable, % | 7.52 | 11.66 | 10.99 | 9.29 | 9.42 | 9.78 | 9.78 | 9.78 | 9.78 | 9.78 |
| Capital Expenditure | -2,041.8 | -1,555.1 | -1,450.8 | -856.9 | -1,111.7 | -2,540.0 | -3,000.0 | -3,543.3 | -4,184.9 | -4,942.7 |
| Capital Expenditure, % | -33.09 | -21.81 | -17.01 | -8.43 | -9.26 | -17.92 | -17.92 | -17.92 | -17.92 | -17.92 |
| Tax Rate, % | 24.85 | 24.85 | 24.85 | 24.85 | 24.85 | 24.85 | 24.85 | 24.85 | 24.85 | 24.85 |
| EBITAT | 2,271.2 | 1,686.7 | 2,235.7 | 2,888.1 | 3,457.5 | 4,075.7 | 4,813.8 | 5,685.5 | 6,715.1 | 7,931.1 |
| Depreciation | ||||||||||
| Changes in Account Receivables | ||||||||||
| Changes in Inventories | ||||||||||
| Changes in Accounts Payable | ||||||||||
| Capital Expenditure | ||||||||||
| UFCF | -2,713.5 | 110.5 | 713.7 | 2,232.8 | 1,020.4 | 1,571.2 | 1,405.5 | 1,660.0 | 1,960.6 | 2,315.6 |
| WACC, % | 7.14 | 7.14 | 7.14 | 7.14 | 7.14 | 7.14 | 7.14 | 7.14 | 7.14 | 7.14 |
| PV UFCF | ||||||||||
| SUM PV UFCF | 7,169.1 | |||||||||
| Long Term Growth Rate, % | 2.00 | |||||||||
| Free cash flow (T + 1) | 2,362 | |||||||||
| Terminal Value | 45,967 | |||||||||
| Present Terminal Value | 32,563 | |||||||||
| Enterprise Value | 39,732 | |||||||||
| Net Debt | 18 | |||||||||
| Equity Value | 39,714 | |||||||||
| Diluted Shares Outstanding, MM | 105 | |||||||||
| Equity Value Per Share | 379.62 |
What You Will Receive
- Accurate CONCORDBIONS Financial Data: Pre-loaded with Concord Biotech’s historical and forecasted figures for detailed analysis.
- Customizable Template: Easily adjust essential inputs such as revenue growth, WACC, and EBITDA %.
- Instant Calculations: Observe the intrinsic value of Concord Biotech update in real-time as you make changes.
- Expert Valuation Tool: Tailored for investors, analysts, and consultants aiming for precise DCF results.
- Intuitive Design: Clear layout and straightforward instructions suitable for all levels of expertise.
Key Features
- Customizable Financial Inputs: Adjust essential parameters such as revenue growth, EBITDA %, and capital expenditures.
- Instant DCF Valuation: Automatically computes intrinsic value, NPV, and additional financial metrics.
- High Precision Accuracy: Leverages Concord Biotech Limited's (CONCORDBIONS) actual financial data for reliable valuation results.
- Simplified Scenario Analysis: Effortlessly evaluate various assumptions and analyze their impacts.
- Efficiency Boost: Save time by avoiding the need to create intricate valuation models from the ground up.
How It Works
- Step 1: Download the Excel file for Concord Biotech Limited (CONCORDBIONS).
- Step 2: Review the pre-filled financial data and projections for Concord Biotech.
- Step 3: Adjust key inputs such as revenue growth, WACC, and tax rates (highlighted cells).
- Step 4: Observe the DCF model update in real-time as you change your assumptions.
- Step 5: Analyze the results and utilize the insights for your investment decisions.
Why Opt for This Calculator?
- User-Friendly Interface: Tailored for both novices and seasoned professionals.
- Customizable Inputs: Easily adjust parameters to suit your analysis needs.
- Real-Time Feedback: Observe immediate updates to Concord Biotech Limited's (CONCORDBIONS) valuation as you modify inputs.
- Preloaded Data: Comes equipped with Concord Biotech Limited's (CONCORDBIONS) actual financial information for swift evaluations.
- Relied Upon by Experts: Employed by investors and analysts for making well-informed choices.
Who Should Consider Using Concord Biotech Limited (CONCORDBIONS)?
- Individual Investors: Make educated choices regarding the purchase or sale of shares in Concord Biotech.
- Financial Analysts: Optimize your valuation processes with readily available financial models tailored for Concord Biotech.
- Consultants: Provide clients with precise and efficient valuation insights related to Concord Biotech.
- Business Owners: Gain perspective on how major biotechnology companies like Concord Biotech are valued to inform your own business strategies.
- Finance Students: Explore valuation techniques through the lens of real-world data and scenarios from Concord Biotech.
What the Template Contains
- Historical Data: Comprises Concord Biotech Limited’s (CONCORDBIONS) previous financial performance and baseline forecasts.
- DCF and Levered DCF Models: Comprehensive templates to compute the intrinsic value of Concord Biotech Limited (CONCORDBIONS).
- WACC Sheet: Pre-built calculations for Weighted Average Cost of Capital.
- Editable Inputs: Adjust key parameters such as growth rates, EBITDA percentages, and CAPEX assumptions.
- Quarterly and Annual Statements: A thorough analysis of Concord Biotech Limited’s (CONCORDBIONS) financials.
- Interactive Dashboard: Dynamically visualize valuation results and forecasts.
Disclaimer
All information, articles, and product details provided on this website are for general informational and educational purposes only. We do not claim any ownership over, nor do we intend to infringe upon, any trademarks, copyrights, logos, brand names, or other intellectual property mentioned or depicted on this site. Such intellectual property remains the property of its respective owners, and any references here are made solely for identification or informational purposes, without implying any affiliation, endorsement, or partnership.
We make no representations or warranties, express or implied, regarding the accuracy, completeness, or suitability of any content or products presented. Nothing on this website should be construed as legal, tax, investment, financial, medical, or other professional advice. In addition, no part of this site—including articles or product references—constitutes a solicitation, recommendation, endorsement, advertisement, or offer to buy or sell any securities, franchises, or other financial instruments, particularly in jurisdictions where such activity would be unlawful.
All content is of a general nature and may not address the specific circumstances of any individual or entity. It is not a substitute for professional advice or services. Any actions you take based on the information provided here are strictly at your own risk. You accept full responsibility for any decisions or outcomes arising from your use of this website and agree to release us from any liability in connection with your use of, or reliance upon, the content or products found herein.