
|
Constellium SE (CSTM) تقييم DCF |
Fully Editable: Tailor To Your Needs In Excel Or Sheets
Professional Design: Trusted, Industry-Standard Templates
Investor-Approved Valuation Models
MAC/PC Compatible, Fully Unlocked
No Expertise Is Needed; Easy To Follow
Constellium SE (CSTM) Bundle
قم بتبسيط تحليلك وتحسين الدقة باستخدام حاسبة DCF (CSTM)! باستخدام بيانات Constellium SE الفعلية والافتراضات القابلة للتخصيص، تمكنك هذه الأداة من التنبؤ والتحليل والتقييم (CSTM) مثل المستثمر المخضرم.
What You Will Get
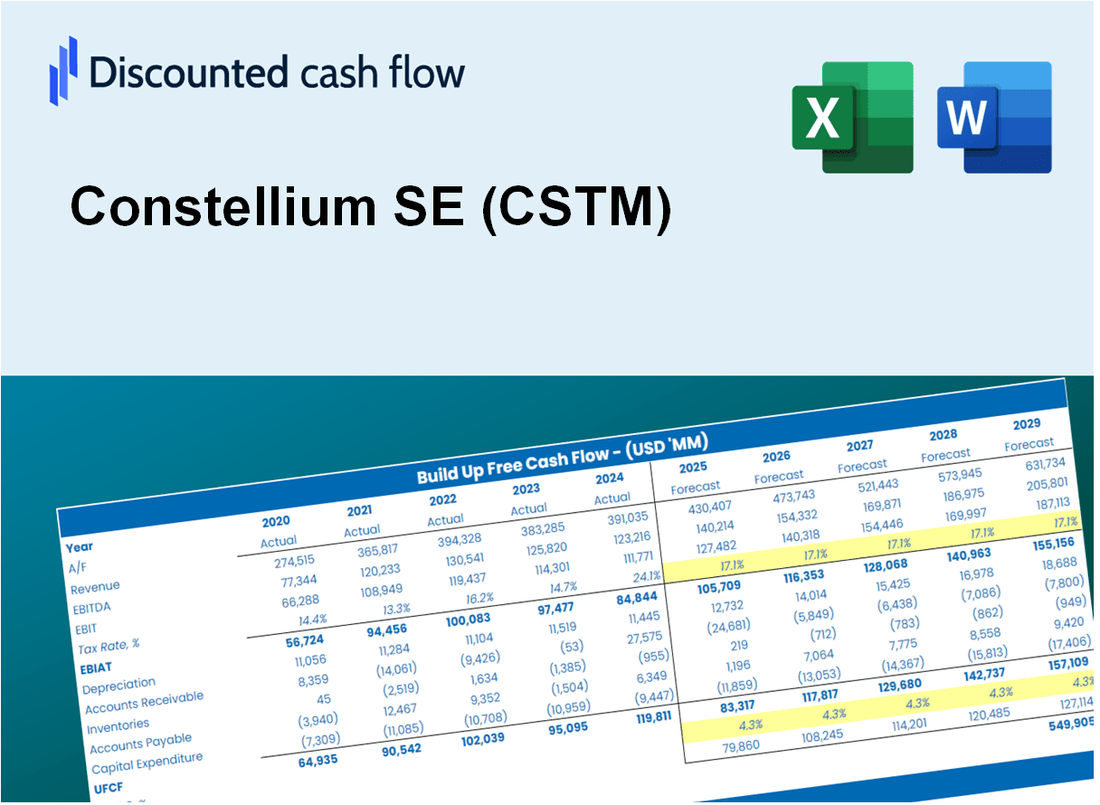
- Real CSTM Financials: Access to historical and forecasted data for precise valuation.
- Customizable Inputs: Adjust WACC, tax rates, revenue growth, and capital expenditures as needed.
- Dynamic Calculations: Intrinsic value and NPV are computed automatically.
- Scenario Analysis: Evaluate various scenarios to assess Constellium's future performance.
- User-Friendly Design: Designed for professionals while remaining approachable for newcomers.
Key Features
- Comprehensive DCF Calculator: Features both unlevered and levered DCF valuation models tailored for Constellium SE (CSTM).
- WACC Calculator: Pre-configured Weighted Average Cost of Capital sheet with adjustable parameters.
- Customizable Forecast Assumptions: Easily alter growth rates, capital expenditures, and discount rates.
- Integrated Financial Ratios: Evaluate profitability, leverage, and efficiency ratios specifically for Constellium SE (CSTM).
- Interactive Dashboard and Charts: Visual representations highlight key valuation metrics for straightforward analysis.
How It Works
- Download the Template: Gain immediate access to the Excel-based CSTM DCF Calculator.
- Input Your Assumptions: Modify the yellow-highlighted cells for growth rates, WACC, margins, and other variables.
- Instant Calculations: The model automatically recalculates Constellium’s intrinsic value.
- Test Scenarios: Experiment with various assumptions to assess potential changes in valuation.
- Analyze and Decide: Utilize the outcomes to inform your investment or financial analysis.
Why Choose Constellium SE (CSTM)?
- Innovative Solutions: Benefit from cutting-edge technology and advanced materials tailored to your needs.
- Commitment to Sustainability: Our practices prioritize environmental responsibility and resource efficiency.
- Global Expertise: Leverage our extensive experience and knowledge across various industries.
- Customer-Centric Approach: We focus on understanding and meeting the unique requirements of our clients.
- Proven Track Record: Trusted by industry leaders for delivering high-quality products and services.
Who Should Use This Product?
- Finance Students: Understand advanced valuation methods and apply them to real-time data.
- Academics: Utilize industry-standard models for teaching or scholarly research.
- Investors: Validate your investment hypotheses and evaluate valuation results for Constellium SE (CSTM).
- Analysts: Enhance your efficiency with a ready-to-use, customizable DCF model.
- Small Business Owners: Learn how major corporations like Constellium SE (CSTM) are assessed in the market.
What the Template Contains
- Preloaded CSTM Data: Historical and projected financial data, including revenue, EBIT, and capital expenditures.
- DCF and WACC Models: Professional-grade sheets for calculating intrinsic value and Weighted Average Cost of Capital.
- Editable Inputs: Yellow-highlighted cells for adjusting revenue growth, tax rates, and discount rates.
- Financial Statements: Comprehensive annual and quarterly financials for deeper analysis.
- Key Ratios: Profitability, leverage, and efficiency ratios to evaluate performance.
- Dashboard and Charts: Visual summaries of valuation outcomes and assumptions.
Disclaimer
All information, articles, and product details provided on this website are for general informational and educational purposes only. We do not claim any ownership over, nor do we intend to infringe upon, any trademarks, copyrights, logos, brand names, or other intellectual property mentioned or depicted on this site. Such intellectual property remains the property of its respective owners, and any references here are made solely for identification or informational purposes, without implying any affiliation, endorsement, or partnership.
We make no representations or warranties, express or implied, regarding the accuracy, completeness, or suitability of any content or products presented. Nothing on this website should be construed as legal, tax, investment, financial, medical, or other professional advice. In addition, no part of this site—including articles or product references—constitutes a solicitation, recommendation, endorsement, advertisement, or offer to buy or sell any securities, franchises, or other financial instruments, particularly in jurisdictions where such activity would be unlawful.
All content is of a general nature and may not address the specific circumstances of any individual or entity. It is not a substitute for professional advice or services. Any actions you take based on the information provided here are strictly at your own risk. You accept full responsibility for any decisions or outcomes arising from your use of this website and agree to release us from any liability in connection with your use of, or reliance upon, the content or products found herein.