
|
Daktronics ، Inc. (Dakt) DCF تقييم |
Fully Editable: Tailor To Your Needs In Excel Or Sheets
Professional Design: Trusted, Industry-Standard Templates
Investor-Approved Valuation Models
MAC/PC Compatible, Fully Unlocked
No Expertise Is Needed; Easy To Follow
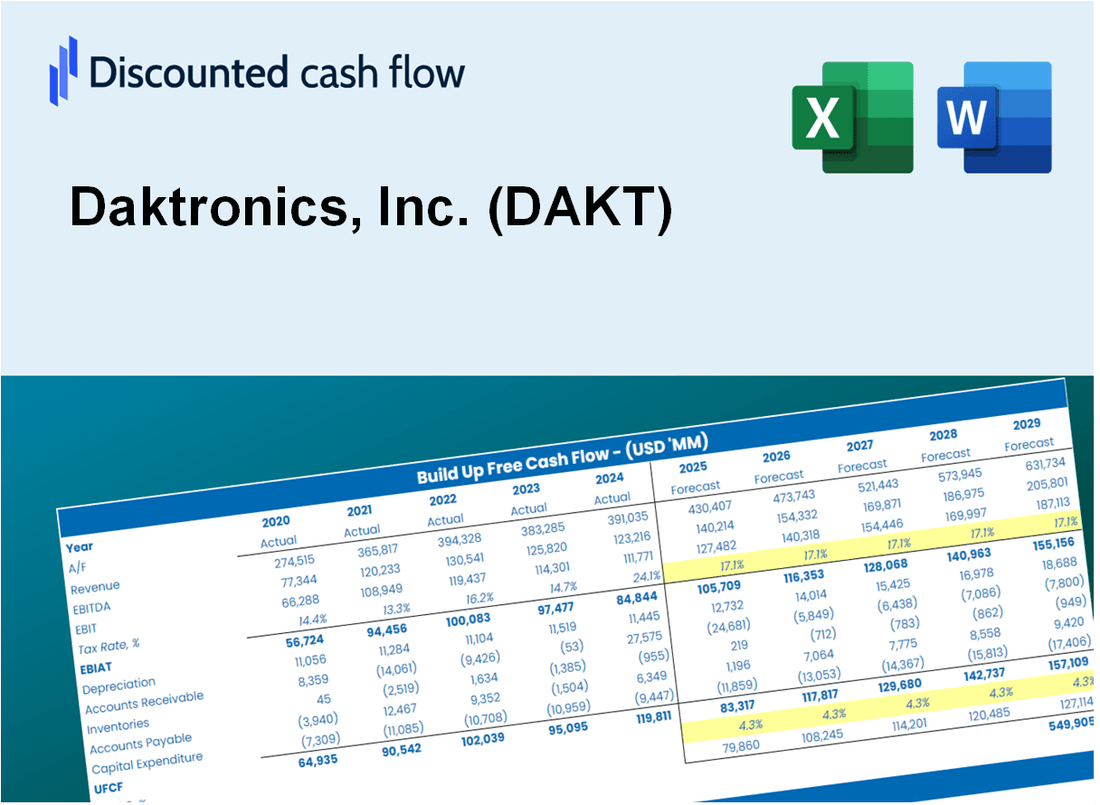
Daktronics, Inc. (DAKT) Bundle
Discover Daktronics ، Inc. (DAKT) الإمكانات الحقيقية مع حاسبة DCF المتقدمة لدينا! اضبط الافتراضات الرئيسية واستكشاف السيناريوهات المختلفة وتقييم كيفية تأثير التغييرات على تقييم Daktronics ، Inc. (DAKT) - كل ذلك ضمن قالب Excel واحد مناسب.
What You Will Get
- Editable Forecast Inputs: Easily modify assumptions (growth %, margins, WACC) to create various scenarios.
- Real-World Data: Daktronics, Inc. (DAKT) financial data pre-filled to kickstart your analysis.
- Automatic DCF Outputs: The template computes Net Present Value (NPV) and intrinsic value for you.
- Customizable and Professional: A refined Excel model that adjusts to your valuation requirements.
- Built for Analysts and Investors: Perfect for testing forecasts, validating strategies, and enhancing efficiency.
Key Features
- Customizable Financial Inputs: Adjust essential parameters such as sales growth, operating margin, and capital investments.
- Instant DCF Valuation: Quickly computes intrinsic value, net present value (NPV), and additional financial metrics.
- High-Precision Accuracy: Incorporates Daktronics’ actual financial data for trustworthy valuation results.
- Effortless Scenario Analysis: Explore various assumptions and analyze results with ease.
- Efficiency Booster: Avoid the hassle of creating intricate valuation models from the ground up.
How It Works
- Step 1: Download the prebuilt Excel template with Daktronics, Inc. (DAKT) data included.
- Step 2: Explore the pre-filled sheets and familiarize yourself with the key metrics.
- Step 3: Update forecasts and assumptions in the editable yellow cells (WACC, growth, margins).
- Step 4: Instantly view recalculated results, including Daktronics, Inc. (DAKT)'s intrinsic value.
- Step 5: Make informed investment decisions or generate reports using the outputs.
Why Choose This Calculator for Daktronics, Inc. (DAKT)?
- Designed for Experts: A sophisticated tool utilized by industry analysts, CFOs, and financial consultants.
- Comprehensive Data: Daktronics' historical and projected financials integrated for precise calculations.
- Flexible Scenario Analysis: Effortlessly test various forecasts and assumptions.
- Insightful Outputs: Automatically computes intrinsic value, NPV, and essential financial metrics.
- User-Friendly: Clear, step-by-step guidance to navigate the calculation process.
Who Should Use This Product?
- Investors: Accurately estimate Daktronics, Inc.'s (DAKT) fair value before making investment decisions.
- CFOs: Utilize a professional-grade DCF model for financial reporting and analysis specific to Daktronics, Inc. (DAKT).
- Consultants: Quickly customize the template for valuation reports tailored to Daktronics, Inc. (DAKT) clients.
- Entrepreneurs: Acquire insights into financial modeling practices used by leading companies like Daktronics, Inc. (DAKT).
- Educators: Implement it as a teaching resource to illustrate valuation methodologies relevant to Daktronics, Inc. (DAKT).
What the Daktronics Template Contains
- Preloaded DAK Data: Historical and projected financial data, including revenue, EBIT, and capital expenditures.
- DCF and WACC Models: Professional-grade sheets for calculating intrinsic value and Weighted Average Cost of Capital.
- Editable Inputs: Yellow-highlighted cells for adjusting revenue growth, tax rates, and discount rates.
- Financial Statements: Comprehensive annual and quarterly financials for deeper analysis.
- Key Ratios: Profitability, leverage, and efficiency ratios to evaluate performance.
- Dashboard and Charts: Visual summaries of valuation outcomes and assumptions.
Disclaimer
All information, articles, and product details provided on this website are for general informational and educational purposes only. We do not claim any ownership over, nor do we intend to infringe upon, any trademarks, copyrights, logos, brand names, or other intellectual property mentioned or depicted on this site. Such intellectual property remains the property of its respective owners, and any references here are made solely for identification or informational purposes, without implying any affiliation, endorsement, or partnership.
We make no representations or warranties, express or implied, regarding the accuracy, completeness, or suitability of any content or products presented. Nothing on this website should be construed as legal, tax, investment, financial, medical, or other professional advice. In addition, no part of this site—including articles or product references—constitutes a solicitation, recommendation, endorsement, advertisement, or offer to buy or sell any securities, franchises, or other financial instruments, particularly in jurisdictions where such activity would be unlawful.
All content is of a general nature and may not address the specific circumstances of any individual or entity. It is not a substitute for professional advice or services. Any actions you take based on the information provided here are strictly at your own risk. You accept full responsibility for any decisions or outcomes arising from your use of this website and agree to release us from any liability in connection with your use of, or reliance upon, the content or products found herein.