
|
Dollar Tree ، Inc. (DLTR) تقييم DCF |
Fully Editable: Tailor To Your Needs In Excel Or Sheets
Professional Design: Trusted, Industry-Standard Templates
Investor-Approved Valuation Models
MAC/PC Compatible, Fully Unlocked
No Expertise Is Needed; Easy To Follow
Dollar Tree, Inc. (DLTR) Bundle
هل تتطلع إلى تقدير القيمة الجوهرية لشركة Dollar Tree، Inc. ؟ تدمج حاسبة DCF (DLTR) الخاصة بنا بيانات العالم الحقيقي مع خيارات التخصيص الشاملة، مما يتيح لك تحسين توقعاتك وتعزيز قرارات الاستثمار الخاصة بك.
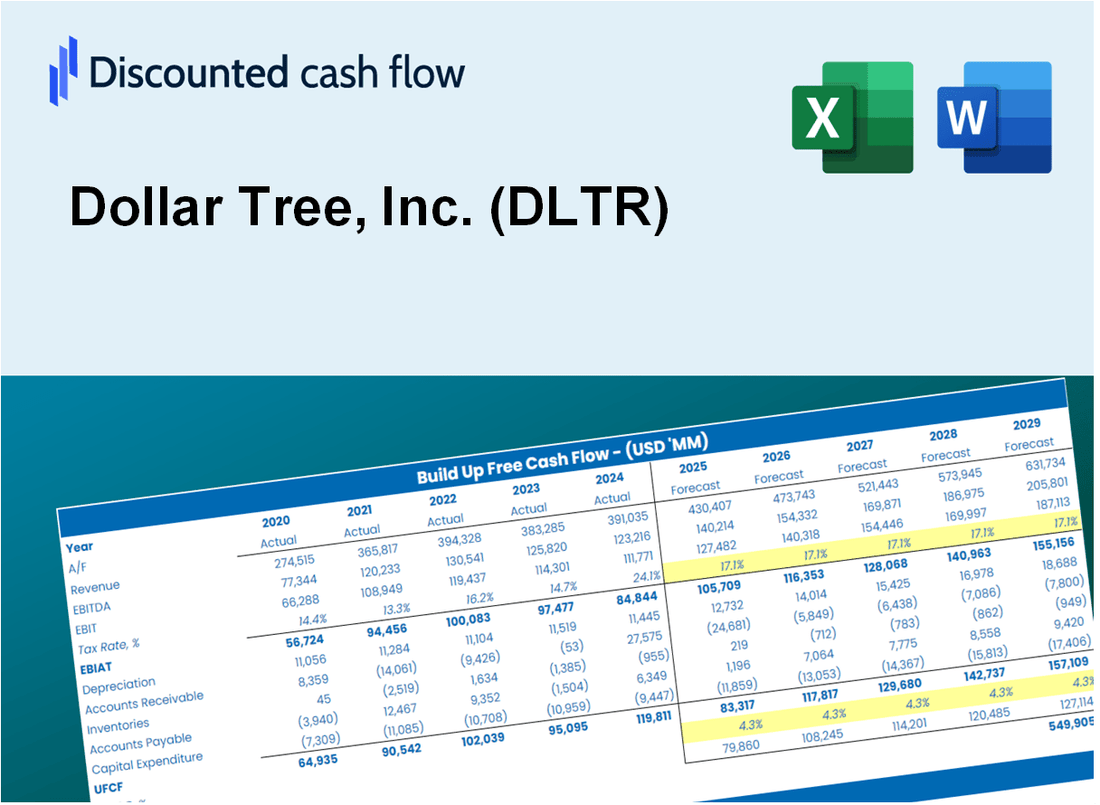
Discounted Cash Flow (DCF) - (USD MM)
| Year | AY1 2020 |
AY2 2021 |
AY3 2022 |
AY4 2023 |
AY5 2024 |
FY1 2025 |
FY2 2026 |
FY3 2027 |
FY4 2028 |
FY5 2029 |
|---|---|---|---|---|---|---|---|---|---|---|
| Revenue | 25,509.3 | 26,321.2 | 15,411.5 | 16,781.1 | 17,578.5 | 16,496.2 | 15,480.6 | 14,527.5 | 13,633.1 | 12,793.7 |
| Revenue Growth, % | 0 | 3.18 | -41.45 | 8.89 | 4.75 | -6.16 | -6.16 | -6.16 | -6.16 | -6.16 |
| EBITDA | 2,573.7 | 2,527.1 | 2,464.2 | 2,174.9 | 2,018.0 | 1,983.5 | 1,861.4 | 1,746.8 | 1,639.2 | 1,538.3 |
| EBITDA, % | 10.09 | 9.6 | 15.99 | 12.96 | 11.48 | 12.02 | 12.02 | 12.02 | 12.02 | 12.02 |
| Depreciation | 686.6 | 716.0 | 365.3 | 400.5 | 526.9 | 434.4 | 407.6 | 382.5 | 359.0 | 336.9 |
| Depreciation, % | 2.69 | 2.72 | 2.37 | 2.39 | 3 | 2.63 | 2.63 | 2.63 | 2.63 | 2.63 |
| EBIT | 1,887.1 | 1,811.1 | 2,098.9 | 1,774.4 | 1,491.1 | 1,549.1 | 1,453.7 | 1,364.2 | 1,280.3 | 1,201.4 |
| EBIT, % | 7.4 | 6.88 | 13.62 | 10.57 | 8.48 | 9.39 | 9.39 | 9.39 | 9.39 | 9.39 |
| Total Cash | 1,416.7 | 984.9 | 642.8 | 425.2 | 1,256.5 | 763.7 | 716.7 | 672.6 | 631.2 | 592.3 |
| Total Cash, percent | .0 | .0 | .0 | .0 | .0 | .0 | .0 | .0 | .0 | .0 |
| Account Receivables | .0 | .0 | .0 | .0 | .0 | .0 | .0 | .0 | .0 | .0 |
| Account Receivables, % | 0 | 0 | 0 | 0 | 0 | 0 | 0 | 0 | 0 | 0 |
| Inventories | 3,427.0 | 4,367.3 | 5,449.3 | 2,495.8 | 2,672.0 | 3,149.4 | 2,955.5 | 2,773.5 | 2,602.8 | 2,442.5 |
| Inventories, % | 13.43 | 16.59 | 35.36 | 14.87 | 15.2 | 19.09 | 19.09 | 19.09 | 19.09 | 19.09 |
| Accounts Payable | 1,480.5 | 1,884.2 | 1,899.8 | 1,167.1 | 1,705.8 | 1,384.0 | 1,298.8 | 1,218.8 | 1,143.8 | 1,073.3 |
| Accounts Payable, % | 5.8 | 7.16 | 12.33 | 6.95 | 9.7 | 8.39 | 8.39 | 8.39 | 8.39 | 8.39 |
| Capital Expenditure | -898.8 | -1,022.8 | -1,253.8 | -2,107.6 | -1,299.4 | -1,171.1 | -1,099.0 | -1,031.3 | -967.8 | -908.3 |
| Capital Expenditure, % | -3.52 | -3.89 | -8.14 | -12.56 | -7.39 | -7.1 | -7.1 | -7.1 | -7.1 | -7.1 |
| Tax Rate, % | 319 | 319 | 319 | 319 | 319 | 319 | 319 | 319 | 319 | 319 |
| EBITAT | 1,455.5 | 1,473.4 | 1,719.6 | -1,066.0 | -3,265.5 | 744.9 | 699.0 | 656.0 | 615.6 | 577.7 |
| Depreciation | ||||||||||
| Changes in Account Receivables | ||||||||||
| Changes in Inventories | ||||||||||
| Changes in Accounts Payable | ||||||||||
| Capital Expenditure | ||||||||||
| UFCF | -703.2 | 630.0 | -235.3 | -552.3 | -3,675.5 | -791.1 | 116.3 | 109.2 | 102.5 | 96.1 |
| WACC, % | 6.2 | 6.24 | 6.24 | 5.46 | 5.46 | 5.92 | 5.92 | 5.92 | 5.92 | 5.92 |
| PV UFCF | ||||||||||
| SUM PV UFCF | -397.8 | |||||||||
| Long Term Growth Rate, % | 3.00 | |||||||||
| Free cash flow (T + 1) | 99 | |||||||||
| Terminal Value | 3,392 | |||||||||
| Present Terminal Value | 2,545 | |||||||||
| Enterprise Value | 2,147 | |||||||||
| Net Debt | 6,574 | |||||||||
| Equity Value | -4,427 | |||||||||
| Diluted Shares Outstanding, MM | 216 | |||||||||
| Equity Value Per Share | -20.51 |
What You Will Receive
- Adjustable Forecast Inputs: Effortlessly modify assumptions (growth %, margins, WACC) to explore various scenarios.
- Comprehensive Data: Dollar Tree, Inc.'s (DLTR) financial data pre-loaded to facilitate your analysis.
- Instant DCF Calculations: The template computes Net Present Value (NPV) and intrinsic value automatically.
- Tailored and Professional: A sleek Excel model that caters to your valuation requirements.
- Designed for Analysts and Investors: Perfect for evaluating projections, confirming strategies, and enhancing efficiency.
Key Features
- Comprehensive DCF Calculator: Features detailed unlevered and levered DCF valuation models tailored for Dollar Tree, Inc. (DLTR).
- WACC Calculator: Pre-configured Weighted Average Cost of Capital sheet with adjustable inputs for accurate assessments.
- Customizable Forecast Assumptions: Easily adjust growth rates, capital expenditures, and discount rates to fit your analysis.
- Integrated Financial Ratios: Evaluate profitability, leverage, and efficiency ratios specific to Dollar Tree, Inc. (DLTR).
- Interactive Dashboard and Charts: Visual representations that summarize essential valuation metrics for straightforward analysis.
How It Works
- Download the Template: Gain immediate access to the Excel-based DLTR DCF Calculator.
- Input Your Assumptions: Modify the yellow-highlighted cells for growth rates, WACC, margins, and more.
- Instant Calculations: The model automatically updates Dollar Tree’s intrinsic value.
- Test Scenarios: Experiment with different assumptions to assess potential valuation changes.
- Analyze and Decide: Utilize the results to inform your investment or financial analysis.
Why Choose This Calculator for Dollar Tree, Inc. (DLTR)?
- Comprehensive Tool: Features DCF, WACC, and financial ratio analyses, all in one convenient package.
- Customizable Inputs: Modify the yellow-highlighted cells to explore different financial scenarios.
- Detailed Insights: Automatically computes Dollar Tree’s intrinsic value and Net Present Value.
- Preloaded Data: Historical and projected data provide accurate starting points for analysis.
- Professional Quality: Perfect for financial analysts, investors, and business consultants focused on Dollar Tree, Inc. (DLTR).
Who Should Use Dollar Tree, Inc. (DLTR)?
- Retail Investors: Make informed investment choices with insights into Dollar Tree's market performance.
- Market Analysts: Streamline your analysis with comprehensive data on Dollar Tree's financial health.
- Consultants: Efficiently tailor reports and presentations focused on Dollar Tree's business strategies.
- Value Shoppers: Enhance your understanding of discount retail strategies and their impact on consumer behavior.
- Students and Educators: Utilize as a case study in retail management and business courses.
What the Template Contains
- Historical Data: Includes Dollar Tree’s past financials and baseline forecasts.
- DCF and Levered DCF Models: Detailed templates to calculate Dollar Tree’s intrinsic value.
- WACC Sheet: Pre-built calculations for Weighted Average Cost of Capital.
- Editable Inputs: Modify key drivers like growth rates, EBITDA %, and CAPEX assumptions.
- Quarterly and Annual Statements: A complete breakdown of Dollar Tree’s financials.
- Interactive Dashboard: Visualize valuation results and projections dynamically.
Disclaimer
All information, articles, and product details provided on this website are for general informational and educational purposes only. We do not claim any ownership over, nor do we intend to infringe upon, any trademarks, copyrights, logos, brand names, or other intellectual property mentioned or depicted on this site. Such intellectual property remains the property of its respective owners, and any references here are made solely for identification or informational purposes, without implying any affiliation, endorsement, or partnership.
We make no representations or warranties, express or implied, regarding the accuracy, completeness, or suitability of any content or products presented. Nothing on this website should be construed as legal, tax, investment, financial, medical, or other professional advice. In addition, no part of this site—including articles or product references—constitutes a solicitation, recommendation, endorsement, advertisement, or offer to buy or sell any securities, franchises, or other financial instruments, particularly in jurisdictions where such activity would be unlawful.
All content is of a general nature and may not address the specific circumstances of any individual or entity. It is not a substitute for professional advice or services. Any actions you take based on the information provided here are strictly at your own risk. You accept full responsibility for any decisions or outcomes arising from your use of this website and agree to release us from any liability in connection with your use of, or reliance upon, the content or products found herein.