
|
Ennis ، Inc. (EBF) تقييم DCF |
Fully Editable: Tailor To Your Needs In Excel Or Sheets
Professional Design: Trusted, Industry-Standard Templates
Investor-Approved Valuation Models
MAC/PC Compatible, Fully Unlocked
No Expertise Is Needed; Easy To Follow
Ennis, Inc. (EBF) Bundle
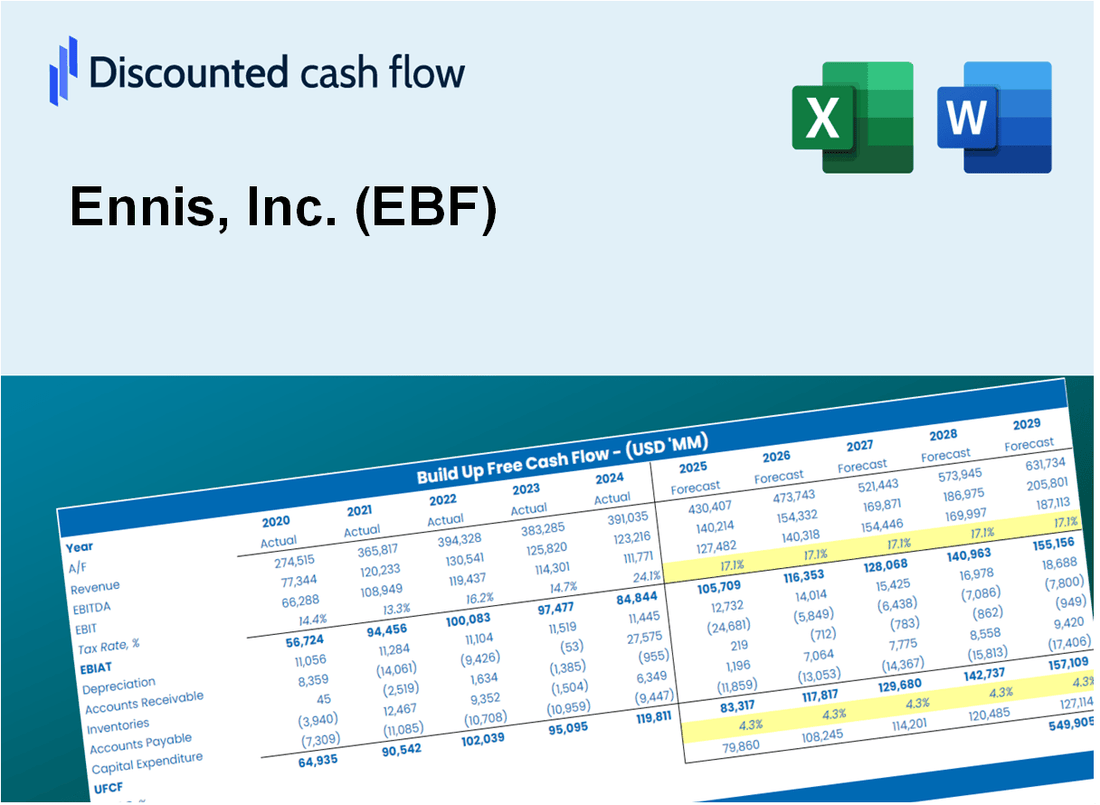
Simplify Ennis ، Inc. (EBF) تقييم مع هذه الآلة الحاسبة DCF القابلة للتخصيص! يضم Deal Ennis ، Inc. (EBF) ماليات ومدخلات تنبؤات قابلة للتعديل ، يمكنك اختبار السيناريوهات وتكشف القيمة العادلة Ennis ، Inc. (EBF) في دقائق.
What You Will Get
- Real EBF Financial Data: Pre-filled with Ennis, Inc.'s historical and projected data for accurate analysis.
- Fully Editable Template: Easily adjust key inputs such as revenue growth, WACC, and EBITDA %.
- Automatic Calculations: Watch Ennis, Inc.'s intrinsic value update in real-time based on your modifications.
- Professional Valuation Tool: Tailored for investors, analysts, and consultants aiming for precise DCF results.
- User-Friendly Design: Intuitive layout and straightforward instructions suitable for all skill levels.
Key Features
- Comprehensive Financial Data: Gain access to precise pre-loaded historical figures and future forecasts for Ennis, Inc. (EBF).
- Adjustable Forecast Parameters: Modify highlighted cells for metrics such as WACC, growth rates, and profit margins.
- Real-Time Calculations: Instant updates to DCF, Net Present Value (NPV), and cash flow assessments.
- User-Friendly Dashboard: Clear charts and summaries to effectively illustrate your valuation insights.
- Designed for All Skill Levels: An intuitive layout tailored for investors, CFOs, and consultants alike.
How It Works
- Step 1: Download the Excel file for Ennis, Inc. (EBF).
- Step 2: Review the pre-filled financial data and forecasts for Ennis, Inc. (EBF).
- Step 3: Adjust key inputs such as revenue growth, WACC, and tax rates (highlighted cells).
- Step 4: Observe the DCF model update in real-time as you modify assumptions.
- Step 5: Evaluate the outputs and leverage the results for your investment choices.
Why Choose This Calculator for Ennis, Inc. (EBF)?
- User-Friendly Interface: Perfectly crafted for both novice and experienced users.
- Customizable Inputs: Effortlessly adjust parameters to suit your financial analysis.
- Real-Time Adjustments: Witness immediate updates to Ennis, Inc.'s (EBF) valuation as you tweak inputs.
- Pre-Loaded Data: Comes with Ennis, Inc.'s (EBF) actual financial information for swift evaluations.
- Relied Upon by Experts: A go-to tool for investors and analysts aiming for data-driven decisions.
Who Should Use This Product?
- Investors: Evaluate Ennis, Inc.’s (EBF) financial health before making investment decisions.
- CFOs and Financial Analysts: Enhance valuation methodologies and assess future forecasts.
- Startup Founders: Discover how established companies like Ennis, Inc. (EBF) are valued in the market.
- Consultants: Provide comprehensive valuation analyses and reports for clients.
- Students and Educators: Utilize current data to learn and teach valuation principles effectively.
What the Template Contains
- Historical Data: Includes Ennis, Inc.'s (EBF) past financials and baseline forecasts.
- DCF and Levered DCF Models: Detailed templates to calculate Ennis, Inc.'s (EBF) intrinsic value.
- WACC Sheet: Pre-built calculations for Weighted Average Cost of Capital.
- Editable Inputs: Modify key drivers like growth rates, EBITDA %, and CAPEX assumptions.
- Quarterly and Annual Statements: A complete breakdown of Ennis, Inc.'s (EBF) financials.
- Interactive Dashboard: Visualize valuation results and projections dynamically.
Disclaimer
All information, articles, and product details provided on this website are for general informational and educational purposes only. We do not claim any ownership over, nor do we intend to infringe upon, any trademarks, copyrights, logos, brand names, or other intellectual property mentioned or depicted on this site. Such intellectual property remains the property of its respective owners, and any references here are made solely for identification or informational purposes, without implying any affiliation, endorsement, or partnership.
We make no representations or warranties, express or implied, regarding the accuracy, completeness, or suitability of any content or products presented. Nothing on this website should be construed as legal, tax, investment, financial, medical, or other professional advice. In addition, no part of this site—including articles or product references—constitutes a solicitation, recommendation, endorsement, advertisement, or offer to buy or sell any securities, franchises, or other financial instruments, particularly in jurisdictions where such activity would be unlawful.
All content is of a general nature and may not address the specific circumstances of any individual or entity. It is not a substitute for professional advice or services. Any actions you take based on the information provided here are strictly at your own risk. You accept full responsibility for any decisions or outcomes arising from your use of this website and agree to release us from any liability in connection with your use of, or reliance upon, the content or products found herein.