
|
Properties ، Inc. (ELS) DCF Properties ، Inc. |
Fully Editable: Tailor To Your Needs In Excel Or Sheets
Professional Design: Trusted, Industry-Standard Templates
Investor-Approved Valuation Models
MAC/PC Compatible, Fully Unlocked
No Expertise Is Needed; Easy To Follow
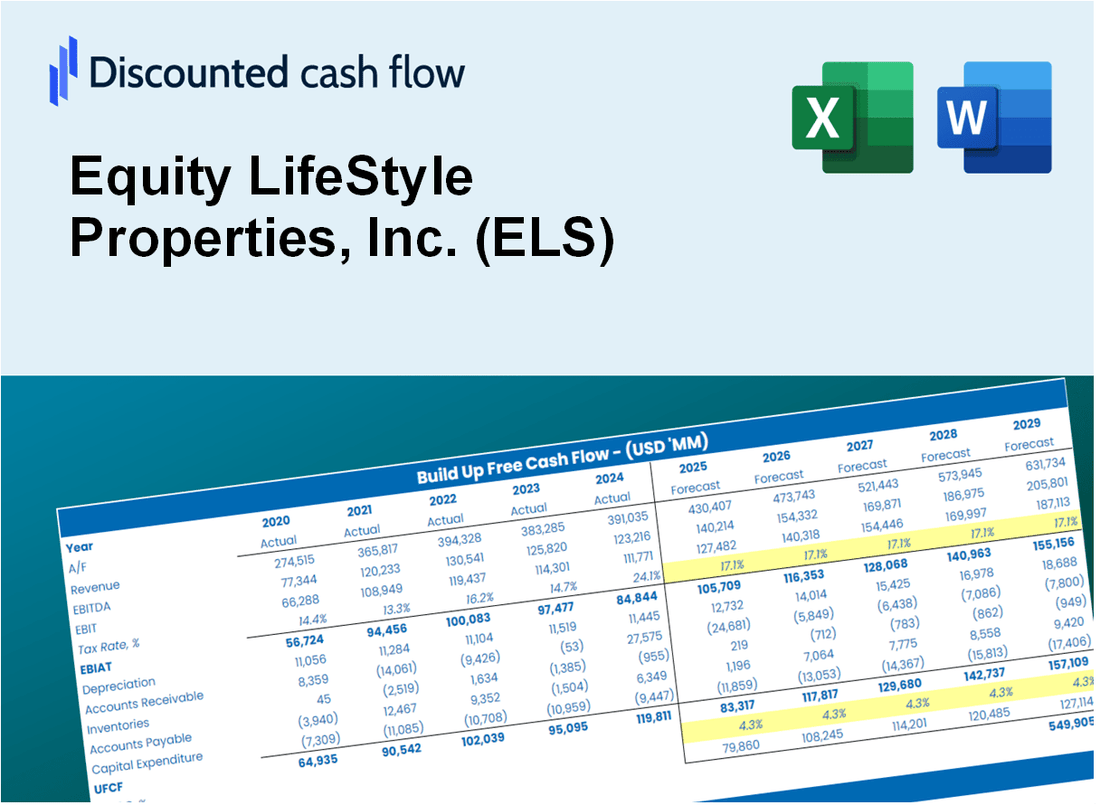
Equity LifeStyle Properties, Inc. (ELS) Bundle
تبسيط تقييم Equity Lifestyle Properties ، Inc. (ELS) مع هذه الآلة الحاسبة DCF القابلة للتخصيص! يضم Deal Real Lifity Lifestyle Properties ، Inc. (ELS) ومدخلات التنبؤ القابلة للتعديل ، يمكنك اختبار السيناريوهات وكشف القيمة العادلة لقيمة Lifestyle Properties ، Inc. (ELS) في دقائق.
Discounted Cash Flow (DCF) - (USD MM)
| Year | AY1 2020 |
AY2 2021 |
AY3 2022 |
AY4 2023 |
AY5 2024 |
FY1 2025 |
FY2 2026 |
FY3 2027 |
FY4 2028 |
FY5 2029 |
|---|---|---|---|---|---|---|---|---|---|---|
| Revenue | 1,107.6 | 1,254.5 | 1,375.0 | 1,404.3 | 1,433.3 | 1,530.3 | 1,633.8 | 1,744.3 | 1,862.3 | 1,988.3 |
| Revenue Growth, % | 0 | 13.26 | 9.6 | 2.13 | 2.07 | 6.77 | 6.77 | 6.77 | 6.77 | 6.77 |
| EBITDA | 496.5 | 576.2 | 622.4 | 660.6 | 731.6 | 716.5 | 765.0 | 816.7 | 872.0 | 931.0 |
| EBITDA, % | 44.83 | 45.93 | 45.27 | 47.04 | 51.04 | 46.82 | 46.82 | 46.82 | 46.82 | 46.82 |
| Depreciation | 157.8 | 191.4 | 207.1 | 209.1 | 209.4 | 226.7 | 242.0 | 258.4 | 275.9 | 294.5 |
| Depreciation, % | 14.24 | 15.26 | 15.06 | 14.89 | 14.61 | 14.81 | 14.81 | 14.81 | 14.81 | 14.81 |
| EBIT | 338.8 | 384.7 | 415.4 | 451.5 | 522.2 | 489.8 | 523.0 | 558.4 | 596.1 | 636.5 |
| EBIT, % | 30.59 | 30.67 | 30.21 | 32.15 | 36.43 | 32.01 | 32.01 | 32.01 | 32.01 | 32.01 |
| Total Cash | 24.1 | 94.1 | 2.6 | 4.2 | 5.6 | 32.3 | 34.5 | 36.8 | 39.3 | 42.0 |
| Total Cash, percent | .0 | .0 | .0 | .0 | .0 | .0 | .0 | .0 | .0 | .0 |
| Account Receivables | 35.8 | 40.0 | 45.4 | 49.9 | 50.7 | 51.5 | 54.9 | 58.7 | 62.6 | 66.9 |
| Account Receivables, % | 3.24 | 3.18 | 3.3 | 3.56 | 3.54 | 3.36 | 3.36 | 3.36 | 3.36 | 3.36 |
| Inventories | .0 | .0 | .0 | .0 | .0 | .0 | .0 | .0 | .0 | .0 |
| Inventories, % | 0 | 0 | 0 | 0 | 0 | 0 | 0 | 0 | 0 | 0 |
| Accounts Payable | 129.7 | 172.3 | 175.1 | 151.6 | 159.2 | 183.9 | 196.3 | 209.6 | 223.8 | 238.9 |
| Accounts Payable, % | 11.71 | 13.73 | 12.74 | 10.79 | 11.11 | 12.02 | 12.02 | 12.02 | 12.02 | 12.02 |
| Capital Expenditure | -168.0 | -204.3 | -249.3 | -317.1 | -241.3 | -272.4 | -290.8 | -310.5 | -331.5 | -353.9 |
| Capital Expenditure, % | -15.16 | -16.28 | -18.13 | -22.58 | -16.83 | -17.8 | -17.8 | -17.8 | -17.8 | -17.8 |
| Tax Rate, % | 4.54 | 4.54 | 4.54 | 4.54 | 4.54 | 4.54 | 4.54 | 4.54 | 4.54 | 4.54 |
| EBITAT | 327.7 | 365.9 | 395.7 | 444.5 | 498.5 | 471.2 | 503.1 | 537.1 | 573.5 | 612.2 |
| Depreciation | ||||||||||
| Changes in Account Receivables | ||||||||||
| Changes in Inventories | ||||||||||
| Changes in Accounts Payable | ||||||||||
| Capital Expenditure | ||||||||||
| UFCF | 411.3 | 391.5 | 350.9 | 308.3 | 473.5 | 449.4 | 463.3 | 494.6 | 528.1 | 563.8 |
| WACC, % | 6.5 | 6.49 | 6.49 | 6.52 | 6.49 | 6.5 | 6.5 | 6.5 | 6.5 | 6.5 |
| PV UFCF | ||||||||||
| SUM PV UFCF | 2,062.0 | |||||||||
| Long Term Growth Rate, % | 4.00 | |||||||||
| Free cash flow (T + 1) | 586 | |||||||||
| Terminal Value | 23,486 | |||||||||
| Present Terminal Value | 17,145 | |||||||||
| Enterprise Value | 19,207 | |||||||||
| Net Debt | 3,199 | |||||||||
| Equity Value | 16,008 | |||||||||
| Diluted Shares Outstanding, MM | 197 | |||||||||
| Equity Value Per Share | 81.41 |
What You Will Get
- Editable Forecast Inputs: Easily adjust key assumptions (growth %, margins, WACC) to explore various scenarios.
- Real-World Data: Equity LifeStyle Properties, Inc. (ELS) financial data pre-filled to accelerate your analysis.
- Automatic DCF Outputs: The template computes Net Present Value (NPV) and intrinsic value automatically.
- Customizable and Professional: A refined Excel model that caters to your valuation requirements.
- Built for Analysts and Investors: Perfect for testing projections, validating strategies, and enhancing efficiency.
Key Features
- Real-Life ELS Data: Pre-filled with Equity LifeStyle Properties' historical financials and future projections.
- Fully Customizable Inputs: Modify revenue growth, operating margins, WACC, tax rates, and capital expenditures.
- Dynamic Valuation Model: Automatic updates to Net Present Value (NPV) and intrinsic value based on your adjustments.
- Scenario Testing: Develop multiple forecast scenarios to explore various valuation outcomes.
- User-Friendly Design: Intuitive, organized, and tailored for both professionals and newcomers.
How It Works
- Step 1: Download the Excel file for Equity LifeStyle Properties, Inc. (ELS).
- Step 2: Review ELS’s pre-filled financial data and forecasts.
- Step 3: Modify key inputs such as revenue growth, WACC, and tax rates (highlighted cells).
- Step 4: Observe the DCF model update in real-time as you adjust the assumptions.
- Step 5: Analyze the outputs and leverage the results for your investment decisions.
Why Choose This Calculator for Equity LifeStyle Properties, Inc. (ELS)?
- User-Friendly Interface: Tailored for both novice and seasoned users.
- Customizable Inputs: Easily adjust parameters to suit your financial analysis.
- Real-Time Valuation: Observe immediate updates to ELS's valuation as you modify inputs.
- Pre-Loaded Data: Comes equipped with Equity LifeStyle's actual financial metrics for swift evaluation.
- Industry Approved: Utilized by financial analysts and investors for making well-informed choices.
Who Should Use This Product?
- Investors: Evaluate Equity LifeStyle Properties, Inc.'s (ELS) market performance before making investment decisions.
- CFOs and Financial Analysts: Optimize valuation methodologies and assess financial forecasts for ELS.
- Real Estate Developers: Understand how publicly traded companies like ELS are appraised in the market.
- Consultants: Create comprehensive valuation assessments for clients in the real estate sector.
- Students and Educators: Utilize current market data to learn and teach real estate valuation strategies.
What the Template Contains
- Historical Data: Includes Equity LifeStyle Properties, Inc. (ELS)’s past financials and baseline forecasts.
- DCF and Levered DCF Models: Detailed templates to calculate Equity LifeStyle Properties, Inc. (ELS)’s intrinsic value.
- WACC Sheet: Pre-built calculations for Weighted Average Cost of Capital.
- Editable Inputs: Modify key drivers like growth rates, EBITDA %, and CAPEX assumptions.
- Quarterly and Annual Statements: A complete breakdown of Equity LifeStyle Properties, Inc. (ELS)’s financials.
- Interactive Dashboard: Visualize valuation results and projections dynamically.
Disclaimer
All information, articles, and product details provided on this website are for general informational and educational purposes only. We do not claim any ownership over, nor do we intend to infringe upon, any trademarks, copyrights, logos, brand names, or other intellectual property mentioned or depicted on this site. Such intellectual property remains the property of its respective owners, and any references here are made solely for identification or informational purposes, without implying any affiliation, endorsement, or partnership.
We make no representations or warranties, express or implied, regarding the accuracy, completeness, or suitability of any content or products presented. Nothing on this website should be construed as legal, tax, investment, financial, medical, or other professional advice. In addition, no part of this site—including articles or product references—constitutes a solicitation, recommendation, endorsement, advertisement, or offer to buy or sell any securities, franchises, or other financial instruments, particularly in jurisdictions where such activity would be unlawful.
All content is of a general nature and may not address the specific circumstances of any individual or entity. It is not a substitute for professional advice or services. Any actions you take based on the information provided here are strictly at your own risk. You accept full responsibility for any decisions or outcomes arising from your use of this website and agree to release us from any liability in connection with your use of, or reliance upon, the content or products found herein.