
|
Electronics Mart India Limited (Emil.NS) DCF تقييم |
Fully Editable: Tailor To Your Needs In Excel Or Sheets
Professional Design: Trusted, Industry-Standard Templates
Investor-Approved Valuation Models
MAC/PC Compatible, Fully Unlocked
No Expertise Is Needed; Easy To Follow
Electronics Mart India Limited (EMIL.NS) Bundle
استكشف الآفاق المالية لـ Electronics Mart India Limited (Emilns) مع حاسبة DCF سهلة الاستخدام! ما عليك سوى إدخال افتراضاتك المتعلقة بالنمو والهوامش والمصروفات لحساب القيمة الجوهرية للإلكترونيات Mart India Limited (Emilns) وتشكيل نهج الاستثمار الخاص بك.
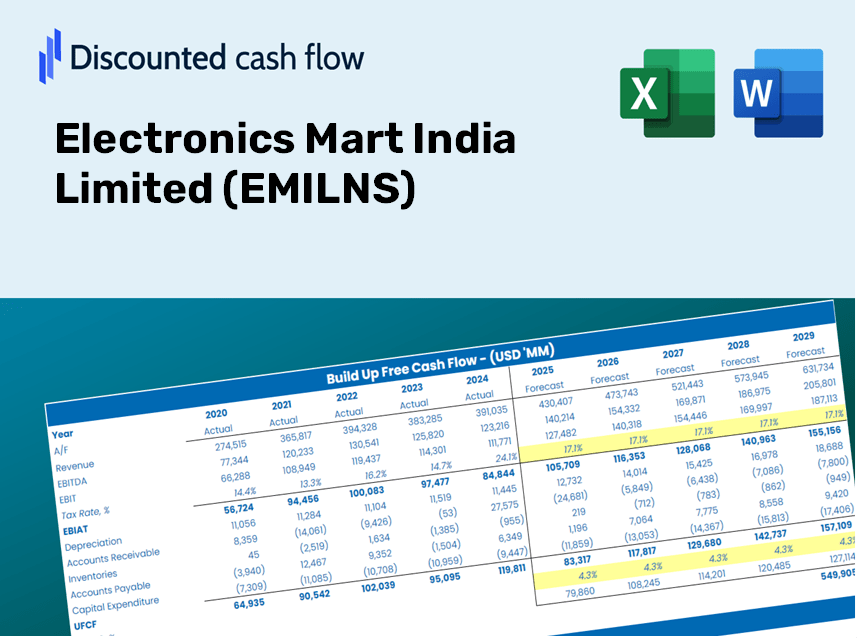
Discounted Cash Flow (DCF) - (USD MM)
| Year | AY1 2021 |
AY2 2022 |
AY3 2023 |
AY4 2024 |
AY5 2025 |
FY1 2026 |
FY2 2027 |
FY3 2028 |
FY4 2029 |
FY5 2030 |
|---|---|---|---|---|---|---|---|---|---|---|
| Revenue | 30,287.9 | 43,493.2 | 54,457.1 | 62,854.1 | 69,648.3 | 86,196.0 | 106,675.4 | 132,020.5 | 163,387.3 | 202,206.6 |
| Revenue Growth, % | 0 | 43.6 | 25.21 | 15.42 | 10.81 | 23.76 | 23.76 | 23.76 | 23.76 | 23.76 |
| EBITDA | 2,093.7 | 2,956.9 | 3,471.1 | 4,568.5 | 4,505.3 | 5,830.7 | 7,216.0 | 8,930.5 | 11,052.3 | 13,678.2 |
| EBITDA, % | 6.91 | 6.8 | 6.37 | 7.27 | 6.47 | 6.76 | 6.76 | 6.76 | 6.76 | 6.76 |
| Depreciation | 581.4 | 713.2 | 853.8 | 1,056.9 | 1,266.9 | 1,487.3 | 1,840.7 | 2,278.0 | 2,819.3 | 3,489.1 |
| Depreciation, % | 1.92 | 1.64 | 1.57 | 1.68 | 1.82 | 1.73 | 1.73 | 1.73 | 1.73 | 1.73 |
| EBIT | 1,512.4 | 2,243.7 | 2,617.3 | 3,511.6 | 3,238.4 | 4,343.4 | 5,375.3 | 6,652.5 | 8,233.0 | 10,189.1 |
| EBIT, % | 4.99 | 5.16 | 4.81 | 5.59 | 4.65 | 5.04 | 5.04 | 5.04 | 5.04 | 5.04 |
| Total Cash | 350.2 | 344.0 | 2,031.6 | 854.7 | 305.3 | 1,288.8 | 1,595.0 | 1,974.0 | 2,443.0 | 3,023.4 |
| Total Cash, percent | .0 | .0 | .0 | .0 | .0 | .0 | .0 | .0 | .0 | .0 |
| Account Receivables | 965.2 | 1,166.3 | 1,479.1 | 1,869.1 | 1,790.5 | 2,435.7 | 3,014.4 | 3,730.6 | 4,617.0 | 5,713.9 |
| Account Receivables, % | 3.19 | 2.68 | 2.72 | 2.97 | 2.57 | 2.83 | 2.83 | 2.83 | 2.83 | 2.83 |
| Inventories | 4,813.7 | 6,138.2 | 7,735.3 | 9,692.8 | 12,421.9 | 13,354.7 | 16,527.6 | 20,454.4 | 25,314.2 | 31,328.6 |
| Inventories, % | 15.89 | 14.11 | 14.2 | 15.42 | 17.84 | 15.49 | 15.49 | 15.49 | 15.49 | 15.49 |
| Accounts Payable | 75.9 | 248.1 | 246.0 | 430.5 | 1,039.8 | 594.8 | 736.2 | 911.1 | 1,127.5 | 1,395.4 |
| Accounts Payable, % | 0.25046 | 0.57034 | 0.45177 | 0.68492 | 1.49 | 0.6901 | 0.6901 | 0.6901 | 0.6901 | 0.6901 |
| Capital Expenditure | -591.5 | -678.8 | -2,466.5 | -1,737.6 | -3,237.3 | -2,664.4 | -3,297.4 | -4,080.8 | -5,050.4 | -6,250.3 |
| Capital Expenditure, % | -1.95 | -1.56 | -4.53 | -2.76 | -4.65 | -3.09 | -3.09 | -3.09 | -3.09 | -3.09 |
| Tax Rate, % | 25.72 | 25.72 | 25.72 | 25.72 | 25.72 | 25.72 | 25.72 | 25.72 | 25.72 | 25.72 |
| EBITAT | 1,114.3 | 1,667.9 | 1,969.5 | 2,624.1 | 2,405.6 | 3,233.9 | 4,002.2 | 4,953.1 | 6,129.9 | 7,586.3 |
| Depreciation | ||||||||||
| Changes in Account Receivables | ||||||||||
| Changes in Inventories | ||||||||||
| Changes in Accounts Payable | ||||||||||
| Capital Expenditure | ||||||||||
| UFCF | -4,598.8 | 348.8 | -1,555.1 | -219.6 | -1,605.9 | 33.8 | -1,064.8 | -1,317.8 | -1,630.9 | -2,018.4 |
| WACC, % | 4.58 | 4.59 | 4.61 | 4.6 | 4.59 | 4.6 | 4.6 | 4.6 | 4.6 | 4.6 |
| PV UFCF | ||||||||||
| SUM PV UFCF | -5,067.3 | |||||||||
| Long Term Growth Rate, % | 3.50 | |||||||||
| Free cash flow (T + 1) | -2,089 | |||||||||
| Terminal Value | -190,518 | |||||||||
| Present Terminal Value | -152,178 | |||||||||
| Enterprise Value | -157,245 | |||||||||
| Net Debt | 19,459 | |||||||||
| Equity Value | -176,704 | |||||||||
| Diluted Shares Outstanding, MM | 385 | |||||||||
| Equity Value Per Share | -459.29 |
ماذا ستتلقى
- مدخلات التنبؤ القابلة للتحرير: تعديل الافتراضات الرئيسية دون عناء (النمو ٪ ، الهوامش ، WACC) لاستكشاف سيناريوهات مختلفة.
- بيانات العالم الحقيقي: البيانات المالية المملوءة مسبقًا لـ Electronics Mart India Limited (Emilns) لبدء تحليلك.
- مخرجات DCF التلقائية: يقوم القالب بحساب القيمة الحالية الصافية (NPV) تلقائيًا والقيمة الجوهرية بالنسبة لك.
- قابل للتخصيص والمهني: نموذج Excel المكرر مصمم لتلبية متطلبات التقييم الخاصة بك.
- مصمم للمحللين والمستثمرين: مثالي لتقييم التوقعات ، والتحقق من الاستراتيجيات ، وتعزيز الكفاءة.
الميزات الرئيسية
- مدخلات مالية قابلة للتخصيص: اضبط المتغيرات الأساسية مثل نمو المبيعات وهامش الأرباح قبل الفوائد والضرائب والإهلاك والاستثمارات الرأسمالية.
- تقييم DCF الفوري: يحسب بسرعة القيمة الجوهرية ، NPV ، والمقاييس المالية المختلفة.
- دقة متفوقة: يعزز البيانات المالية الواقعية من Electronics Mart India Limited (EMILNS) لنتائج التقييم التي يمكن الاعتماد عليها.
- تحليل السيناريو المبسط: قم بتقييم سيناريوهات مختلفة وتقييم النتائج.
- داعم الكفاءة: تجنب متاعب بناء نماذج التقييم المعقدة من الألف إلى الياء.
كيف تعمل
- الخطوة 1: قم بتنزيل ملف Excel for Electronics Mart India Limited (Emilns).
- الخطوة 2: مراجعة البيانات المالية المملوءة مسبقًا وتوقعات Emilns.
- الخطوة 3: اضبط المدخلات الرئيسية مثل نمو الإيرادات و WACC ومعدلات الضرائب (الخلايا المميزة) وفقًا لتحليلك.
- الخطوة 4: راقب تحديث نموذج DCF تلقائيًا أثناء تعديل افتراضاتك.
- الخطوة 5: فحص النتائج وتطبيقها على استراتيجيات الاستثمار الخاصة بك.
لماذا تختار هذه الآلة الحاسبة لـ Electronics Mart India Limited (Emilns)؟
- واجهة سهلة الاستخدام: تم تصميمه تمامًا لكل من القادمين الجدد والمهنيين المتمرسين.
- افتراضات قابلة للتخصيص: تعديل المدخلات دون عناء لتناسب احتياجاتك التحليلية.
- تحديثات الوقت الحقيقي: لاحظ التغييرات الفورية في تقييم إلكترونيات مارت أثناء تعديل مدخلاتك.
- البيانات المحملة مسبقًا: يأتي مزود بأرقام إلكترونيات مارت الفعلية للتقييمات السريعة.
- يفضله الخبراء: اعتمدها المستثمرون والمحللين لاتخاذ القرارات المتعلمة.
من يجب أن يستفيد من هذا المنتج؟
- المستثمرون: تقييم بدقة القيمة العادلة للالكترونيات Mart India Limited (Emilns) قبل اتخاذ خيارات الاستثمار.
- المدير المالي: الاستفادة من نموذج DCF عالي الجودة لتقارير مالية شاملة وتحليلها.
- الاستشاريون: تخصيص القالب بسهولة لتقارير تقييم العميل.
- رواد الأعمال: اكتشف رؤى حول ممارسات النمذجة المالية التي اعتمدتها الشركات الرائدة.
- المعلمون: توظيفها كأداة عملية لتوضيح طرق التقييم المختلفة.
محتويات القالب
- البيانات المليئة مسبقا: يحتوي على البيانات المالية التاريخية والتوقعات لـ Electronics Mart India Limited (Emilns).
- نموذج التدفق النقدي المخفض: نموذج تقييم DCF قابل للتحرير يتميز بحسابات تلقائية.
- متوسط تكلفة رأس المال المرجح (WACC): ورقة عمل مخصصة لحساب WACC بناءً على المدخلات المخصصة.
- النسب المالية الرئيسية: تقييم ربحية Electronics Mart والفعالية والرافعة المالية.
- مدخلات قابلة للتخصيص: بسهولة تعديل معدلات نمو الإيرادات والهوامش والنسب الضريبية.
- لوحة القيادة البديهية: تصور مقاييس التقييم المفتاح من خلال المخططات والجداول.
Disclaimer
All information, articles, and product details provided on this website are for general informational and educational purposes only. We do not claim any ownership over, nor do we intend to infringe upon, any trademarks, copyrights, logos, brand names, or other intellectual property mentioned or depicted on this site. Such intellectual property remains the property of its respective owners, and any references here are made solely for identification or informational purposes, without implying any affiliation, endorsement, or partnership.
We make no representations or warranties, express or implied, regarding the accuracy, completeness, or suitability of any content or products presented. Nothing on this website should be construed as legal, tax, investment, financial, medical, or other professional advice. In addition, no part of this site—including articles or product references—constitutes a solicitation, recommendation, endorsement, advertisement, or offer to buy or sell any securities, franchises, or other financial instruments, particularly in jurisdictions where such activity would be unlawful.
All content is of a general nature and may not address the specific circumstances of any individual or entity. It is not a substitute for professional advice or services. Any actions you take based on the information provided here are strictly at your own risk. You accept full responsibility for any decisions or outcomes arising from your use of this website and agree to release us from any liability in connection with your use of, or reliance upon, the content or products found herein.