
|
Electronics Mart India Limited (Emil.NS) Avaliação DCF |
Totalmente Editável: Adapte-Se Às Suas Necessidades No Excel Ou Planilhas
Design Profissional: Modelos Confiáveis E Padrão Da Indústria
Pré-Construídos Para Uso Rápido E Eficiente
Compatível com MAC/PC, totalmente desbloqueado
Não É Necessária Experiência; Fácil De Seguir
Electronics Mart India Limited (EMIL.NS) Bundle
Explore as perspectivas financeiras da Electronics Mart India Limited (Emilns) com nossa calculadora DCF amigável! Basta inserir suas suposições sobre crescimento, margens e despesas para calcular o valor intrínseco da Electronics Mart India Limited (EMILNS) e moldar sua abordagem de investimento.
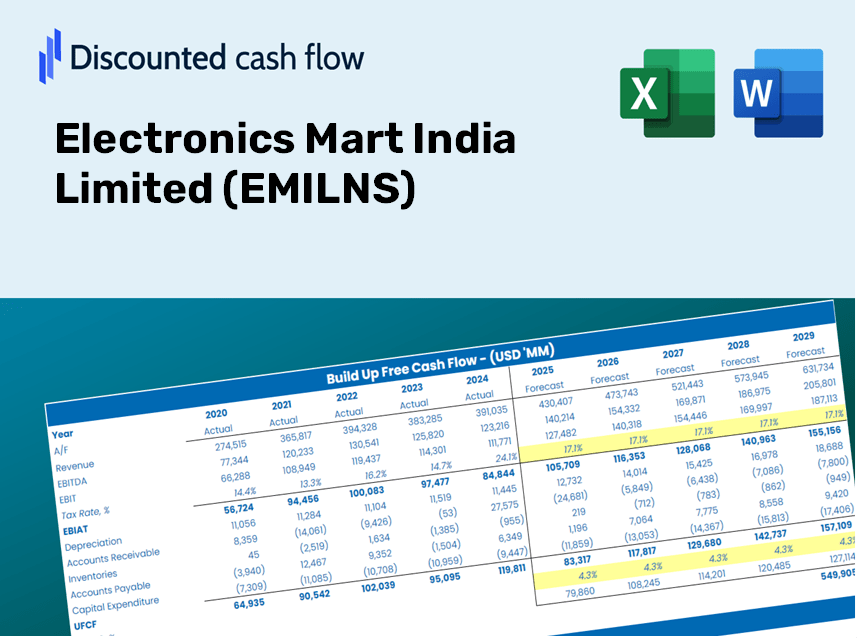
Discounted Cash Flow (DCF) - (USD MM)
| Year | AY1 2021 |
AY2 2022 |
AY3 2023 |
AY4 2024 |
AY5 2025 |
FY1 2026 |
FY2 2027 |
FY3 2028 |
FY4 2029 |
FY5 2030 |
|---|---|---|---|---|---|---|---|---|---|---|
| Revenue | 30,287.9 | 43,493.2 | 54,457.1 | 62,854.1 | 69,648.3 | 86,196.0 | 106,675.4 | 132,020.5 | 163,387.3 | 202,206.6 |
| Revenue Growth, % | 0 | 43.6 | 25.21 | 15.42 | 10.81 | 23.76 | 23.76 | 23.76 | 23.76 | 23.76 |
| EBITDA | 2,093.7 | 2,956.9 | 3,471.1 | 4,568.5 | 4,505.3 | 5,830.7 | 7,216.0 | 8,930.5 | 11,052.3 | 13,678.2 |
| EBITDA, % | 6.91 | 6.8 | 6.37 | 7.27 | 6.47 | 6.76 | 6.76 | 6.76 | 6.76 | 6.76 |
| Depreciation | 581.4 | 713.2 | 853.8 | 1,056.9 | 1,266.9 | 1,487.3 | 1,840.7 | 2,278.0 | 2,819.3 | 3,489.1 |
| Depreciation, % | 1.92 | 1.64 | 1.57 | 1.68 | 1.82 | 1.73 | 1.73 | 1.73 | 1.73 | 1.73 |
| EBIT | 1,512.4 | 2,243.7 | 2,617.3 | 3,511.6 | 3,238.4 | 4,343.4 | 5,375.3 | 6,652.5 | 8,233.0 | 10,189.1 |
| EBIT, % | 4.99 | 5.16 | 4.81 | 5.59 | 4.65 | 5.04 | 5.04 | 5.04 | 5.04 | 5.04 |
| Total Cash | 350.2 | 344.0 | 2,031.6 | 854.7 | 305.3 | 1,288.8 | 1,595.0 | 1,974.0 | 2,443.0 | 3,023.4 |
| Total Cash, percent | .0 | .0 | .0 | .0 | .0 | .0 | .0 | .0 | .0 | .0 |
| Account Receivables | 965.2 | 1,166.3 | 1,479.1 | 1,869.1 | 1,790.5 | 2,435.7 | 3,014.4 | 3,730.6 | 4,617.0 | 5,713.9 |
| Account Receivables, % | 3.19 | 2.68 | 2.72 | 2.97 | 2.57 | 2.83 | 2.83 | 2.83 | 2.83 | 2.83 |
| Inventories | 4,813.7 | 6,138.2 | 7,735.3 | 9,692.8 | 12,421.9 | 13,354.7 | 16,527.6 | 20,454.4 | 25,314.2 | 31,328.6 |
| Inventories, % | 15.89 | 14.11 | 14.2 | 15.42 | 17.84 | 15.49 | 15.49 | 15.49 | 15.49 | 15.49 |
| Accounts Payable | 75.9 | 248.1 | 246.0 | 430.5 | 1,039.8 | 594.8 | 736.2 | 911.1 | 1,127.5 | 1,395.4 |
| Accounts Payable, % | 0.25046 | 0.57034 | 0.45177 | 0.68492 | 1.49 | 0.6901 | 0.6901 | 0.6901 | 0.6901 | 0.6901 |
| Capital Expenditure | -591.5 | -678.8 | -2,466.5 | -1,737.6 | -3,237.3 | -2,664.4 | -3,297.4 | -4,080.8 | -5,050.4 | -6,250.3 |
| Capital Expenditure, % | -1.95 | -1.56 | -4.53 | -2.76 | -4.65 | -3.09 | -3.09 | -3.09 | -3.09 | -3.09 |
| Tax Rate, % | 25.72 | 25.72 | 25.72 | 25.72 | 25.72 | 25.72 | 25.72 | 25.72 | 25.72 | 25.72 |
| EBITAT | 1,114.3 | 1,667.9 | 1,969.5 | 2,624.1 | 2,405.6 | 3,233.9 | 4,002.2 | 4,953.1 | 6,129.9 | 7,586.3 |
| Depreciation | ||||||||||
| Changes in Account Receivables | ||||||||||
| Changes in Inventories | ||||||||||
| Changes in Accounts Payable | ||||||||||
| Capital Expenditure | ||||||||||
| UFCF | -4,598.8 | 348.8 | -1,555.1 | -219.6 | -1,605.9 | 33.8 | -1,064.8 | -1,317.8 | -1,630.9 | -2,018.4 |
| WACC, % | 4.58 | 4.59 | 4.61 | 4.6 | 4.59 | 4.6 | 4.6 | 4.6 | 4.6 | 4.6 |
| PV UFCF | ||||||||||
| SUM PV UFCF | -5,067.3 | |||||||||
| Long Term Growth Rate, % | 3.50 | |||||||||
| Free cash flow (T + 1) | -2,089 | |||||||||
| Terminal Value | -190,518 | |||||||||
| Present Terminal Value | -152,178 | |||||||||
| Enterprise Value | -157,245 | |||||||||
| Net Debt | 19,459 | |||||||||
| Equity Value | -176,704 | |||||||||
| Diluted Shares Outstanding, MM | 385 | |||||||||
| Equity Value Per Share | -459.29 |
What You Will Receive
- Editable Forecast Inputs: Effortlessly modify key assumptions (growth %, margins, WACC) to explore various scenarios.
- Real-World Data: Pre-filled financial data for Electronics Mart India Limited (EMILNS) to kickstart your analysis.
- Automatic DCF Outputs: The template automatically calculates Net Present Value (NPV) and intrinsic value for you.
- Customizable and Professional: A refined Excel model tailored to meet your valuation requirements.
- Designed for Analysts and Investors: Perfect for assessing projections, validating strategies, and enhancing efficiency.
Key Features
- Customizable Financial Inputs: Adjust essential variables such as sales growth, EBITDA margins, and capital investments.
- Instant DCF Valuation: Quickly computes intrinsic value, NPV, and various financial metrics.
- Superior Accuracy: Leverages real-life financial data from Electronics Mart India Limited (EMILNS) for dependable valuation results.
- Streamlined Scenario Analysis: Effortlessly evaluate different scenarios and assess outcomes.
- Efficiency Booster: Avoid the hassle of constructing intricate valuation models from the ground up.
How It Works
- Step 1: Download the Excel file for Electronics Mart India Limited (EMILNS).
- Step 2: Review the pre-filled financial data and forecasts for EMILNS.
- Step 3: Adjust key inputs such as revenue growth, WACC, and tax rates (highlighted cells) according to your analysis.
- Step 4: Observe the DCF model refresh automatically as you modify your assumptions.
- Step 5: Examine the results and apply them to your investment strategies.
Why Choose This Calculator for Electronics Mart India Limited (EMILNS)?
- User-Friendly Interface: Perfectly crafted for both newcomers and seasoned professionals.
- Customizable Assumptions: Effortlessly adjust inputs to suit your analytical needs.
- Real-Time Updates: Observe immediate changes in Electronics Mart's valuation as you modify your inputs.
- Preloaded Data: Comes equipped with Electronics Mart’s actual financial figures for swift evaluations.
- Preferred by Experts: Adopted by investors and analysts for making educated decisions.
Who Should Benefit from This Product?
- Investors: Accurately assess the fair value of Electronics Mart India Limited (EMILNS) before making investment choices.
- CFOs: Utilize a high-quality DCF model for comprehensive financial reporting and analysis.
- Consultants: Easily customize the template for client valuation reports.
- Entrepreneurs: Discover insights into financial modeling practices adopted by leading corporations.
- Educators: Employ it as a practical tool to illustrate various valuation methods.
Contents of the Template
- Pre-Filled Data: Contains historical financials and projections for Electronics Mart India Limited (EMILNS).
- Discounted Cash Flow Model: An editable DCF valuation model featuring automatic calculations.
- Weighted Average Cost of Capital (WACC): A dedicated worksheet for WACC calculation based on your custom inputs.
- Key Financial Ratios: Assess Electronics Mart's profitability, efficiency, and financial leverage.
- Customizable Inputs: Easily modify revenue growth rates, margins, and tax percentages.
- Intuitive Dashboard: Visualize key valuation metrics through charts and tables.
Disclaimer
All information, articles, and product details provided on this website are for general informational and educational purposes only. We do not claim any ownership over, nor do we intend to infringe upon, any trademarks, copyrights, logos, brand names, or other intellectual property mentioned or depicted on this site. Such intellectual property remains the property of its respective owners, and any references here are made solely for identification or informational purposes, without implying any affiliation, endorsement, or partnership.
We make no representations or warranties, express or implied, regarding the accuracy, completeness, or suitability of any content or products presented. Nothing on this website should be construed as legal, tax, investment, financial, medical, or other professional advice. In addition, no part of this site—including articles or product references—constitutes a solicitation, recommendation, endorsement, advertisement, or offer to buy or sell any securities, franchises, or other financial instruments, particularly in jurisdictions where such activity would be unlawful.
All content is of a general nature and may not address the specific circumstances of any individual or entity. It is not a substitute for professional advice or services. Any actions you take based on the information provided here are strictly at your own risk. You accept full responsibility for any decisions or outcomes arising from your use of this website and agree to release us from any liability in connection with your use of, or reliance upon, the content or products found herein.