
|
Enova International ، Inc. (Enva) DCF تقييم |
Fully Editable: Tailor To Your Needs In Excel Or Sheets
Professional Design: Trusted, Industry-Standard Templates
Investor-Approved Valuation Models
MAC/PC Compatible, Fully Unlocked
No Expertise Is Needed; Easy To Follow
Enova International, Inc. (ENVA) Bundle
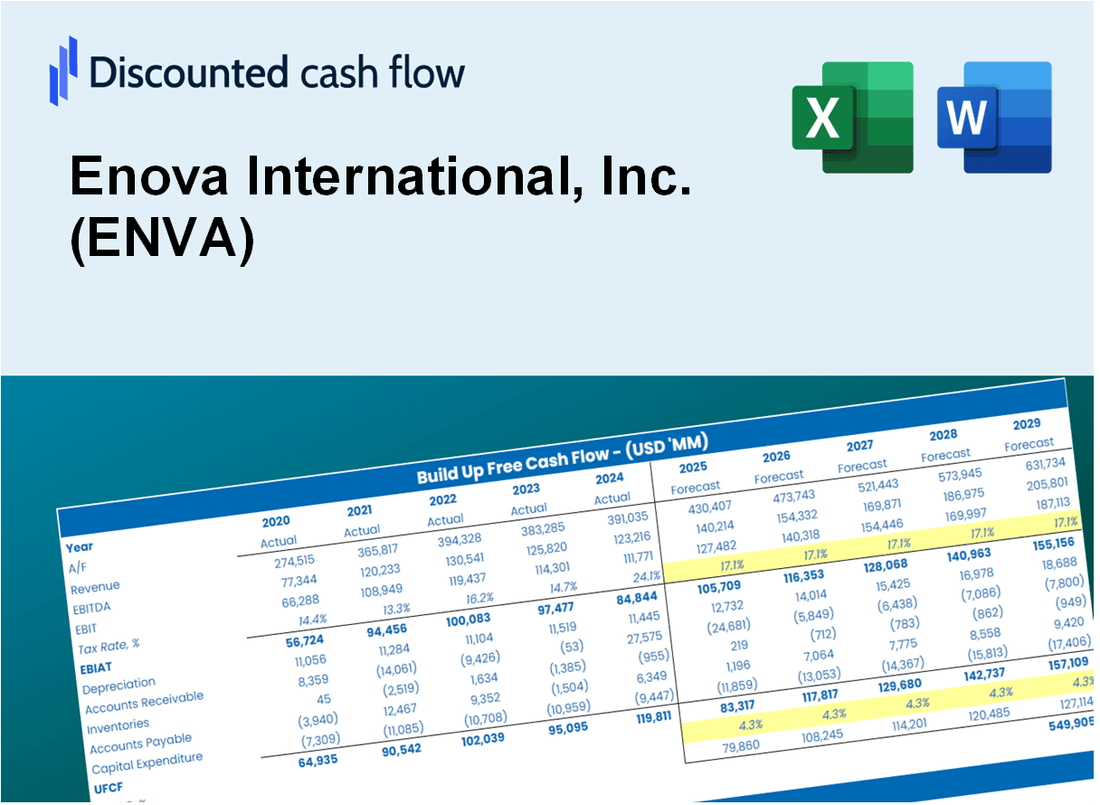
استكشاف Enova International ، Inc. (ENVA) من خلال حاسبة DCF سهلة الاستخدام! أدخل افتراضاتك للنمو والهوامش والمصروفات التي لحقت بحساب Enova International ، Inc. (ENVA) القيمة الجوهرية وتعزيز نهج الاستثمار الخاص بك.
What You Will Receive
- Customizable Excel Template: A fully adjustable Excel-based DCF Calculator featuring pre-filled real ENVA financials.
- Current Market Data: Access to historical data and forward-looking projections (displayed in the highlighted cells).
- Flexible Forecasting: Modify forecast assumptions such as revenue growth, EBITDA %, and WACC.
- Instant Calculations: Quickly observe how your inputs affect Enova International’s valuation.
- Professional Resource: Designed for investors, CFOs, consultants, and financial analysts.
- User-Friendly Interface: Organized for clarity and simplicity, accompanied by step-by-step guidance.
Key Features
- Real-Life ENVA Data: Pre-filled with Enova International’s historical financials and forward-looking projections.
- Fully Customizable Inputs: Adjust revenue growth, margins, WACC, tax rates, and capital expenditures.
- Dynamic Valuation Model: Automatic updates to Net Present Value (NPV) and intrinsic value based on your inputs.
- Scenario Testing: Create multiple forecast scenarios to analyze different valuation outcomes.
- User-Friendly Design: Simple, structured, and designed for professionals and beginners alike.
How It Works
- Download: Obtain the pre-formatted Excel file containing Enova International, Inc.'s (ENVA) financial data.
- Customize: Modify projections, such as revenue growth, EBITDA %, and WACC as per your analysis.
- Update Automatically: The intrinsic value and NPV calculations refresh in real-time for accurate insights.
- Test Scenarios: Generate various forecasts and analyze results side by side effortlessly.
- Make Decisions: Utilize the valuation outcomes to inform and refine your investment approach.
Why Choose Enova International, Inc. (ENVA) Calculator?
- Accuracy: Leverages real Enova financial data for precise calculations.
- Flexibility: Allows users to easily adjust and experiment with various inputs.
- Time-Saving: Eliminate the need to create a financial model from the ground up.
- Professional-Grade: Crafted with the expertise and standards of industry professionals.
- User-Friendly: Intuitive design makes it accessible for users of all experience levels.
Who Should Use This Product?
- Professional Investors: Develop comprehensive and accurate valuation models for assessing investments in Enova International, Inc. (ENVA).
- Corporate Finance Teams: Evaluate valuation scenarios to inform strategic decisions within their organizations.
- Consultants and Advisors: Deliver precise valuation insights for clients interested in Enova International, Inc. (ENVA).
- Students and Educators: Utilize real-time data to enhance learning and practice in financial modeling.
- Finance Enthusiasts: Gain insights into the valuation processes of fintech companies like Enova International, Inc. (ENVA).
What the Template Contains
- Pre-Filled DCF Model: Enova International’s financial data preloaded for immediate use.
- WACC Calculator: Detailed calculations for Weighted Average Cost of Capital.
- Financial Ratios: Evaluate Enova International’s profitability, leverage, and efficiency.
- Editable Inputs: Change assumptions such as growth, margins, and CAPEX to fit your scenarios.
- Financial Statements: Annual and quarterly reports to support detailed analysis.
- Interactive Dashboard: Easily visualize key valuation metrics and results.
Disclaimer
All information, articles, and product details provided on this website are for general informational and educational purposes only. We do not claim any ownership over, nor do we intend to infringe upon, any trademarks, copyrights, logos, brand names, or other intellectual property mentioned or depicted on this site. Such intellectual property remains the property of its respective owners, and any references here are made solely for identification or informational purposes, without implying any affiliation, endorsement, or partnership.
We make no representations or warranties, express or implied, regarding the accuracy, completeness, or suitability of any content or products presented. Nothing on this website should be construed as legal, tax, investment, financial, medical, or other professional advice. In addition, no part of this site—including articles or product references—constitutes a solicitation, recommendation, endorsement, advertisement, or offer to buy or sell any securities, franchises, or other financial instruments, particularly in jurisdictions where such activity would be unlawful.
All content is of a general nature and may not address the specific circumstances of any individual or entity. It is not a substitute for professional advice or services. Any actions you take based on the information provided here are strictly at your own risk. You accept full responsibility for any decisions or outcomes arising from your use of this website and agree to release us from any liability in connection with your use of, or reliance upon, the content or products found herein.