
|
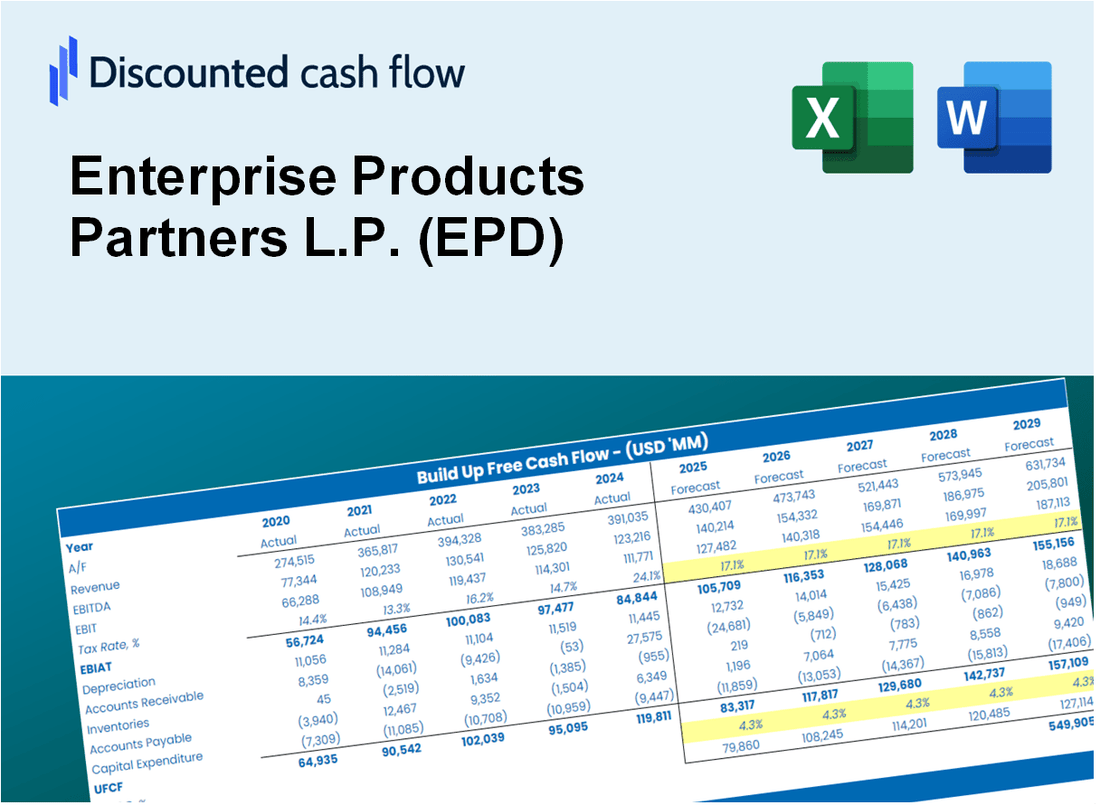
شركاء منتجات Enterprise L.P. (EPD) DCF تقييم |
Fully Editable: Tailor To Your Needs In Excel Or Sheets
Professional Design: Trusted, Industry-Standard Templates
Investor-Approved Valuation Models
MAC/PC Compatible, Fully Unlocked
No Expertise Is Needed; Easy To Follow
Enterprise Products Partners L.P. (EPD) Bundle
تبحث لتحديد القيمة الجوهرية لشركاء منتجات المؤسسات L.P.؟ يدمج حاسبة DCF (EPD) DCF بيانات العالم الحقيقي بميزات تخصيص شاملة ، مما يتيح لك ضبط التوقعات وتعزيز استراتيجيات الاستثمار الخاصة بك.
What You Will Get
- Real EPD Financials: Access to historical and projected data for precise valuation.
- Customizable Inputs: Adjust WACC, tax rates, revenue growth, and capital expenditures as needed.
- Automatic Calculations: Intrinsic value and NPV are computed in real-time.
- Scenario Analysis: Evaluate various scenarios to assess Enterprise Products Partners' future performance.
- User-Friendly Design: Designed for industry professionals while remaining approachable for newcomers.
Key Features
- Comprehensive EPD Data: Pre-loaded with Enterprise Products Partners L.P.'s historical financials and future projections.
- Highly Customizable Inputs: Modify revenue growth rates, profit margins, WACC, tax rates, and capital expenditures.
- Dynamic Valuation Framework: Instant updates to Net Present Value (NPV) and intrinsic value based on your adjustments.
- Scenario Analysis: Develop various forecasting scenarios to evaluate different valuation results.
- Intuitive User Interface: Clean, organized, and designed for both industry professionals and novices.
How It Works
- Download: Obtain the pre-prepared Excel file containing Enterprise Products Partners L.P.'s (EPD) financial data.
- Customize: Modify projections, including revenue growth, EBITDA %, and WACC.
- Update Automatically: The intrinsic value and NPV calculations refresh in real-time.
- Test Scenarios: Generate multiple forecasts and compare results instantly.
- Make Decisions: Leverage the valuation findings to inform your investment approach.
Why Choose This Calculator for Enterprise Products Partners L.P. (EPD)?
- Designed for Experts: A sophisticated tool utilized by financial analysts, CFOs, and industry consultants.
- Accurate Financial Data: EPD’s historical and projected financials are preloaded for precision.
- Scenario Analysis: Effortlessly simulate various forecasts and assumptions.
- Comprehensive Outputs: Instantly calculates intrinsic value, NPV, and essential metrics.
- User-Friendly: Step-by-step guidance ensures a smooth experience throughout the process.
Who Should Use Enterprise Products Partners L.P. (EPD)?
- Investors: Gain insights into energy infrastructure investments with a reliable resource.
- Financial Analysts: Utilize comprehensive data to streamline your analysis of EPD's performance.
- Consultants: Tailor your reports and presentations with up-to-date information on EPD's operations.
- Energy Sector Enthusiasts: Enhance your knowledge of the energy market through EPD's case studies.
- Educators and Students: Leverage EPD as a real-world example in energy finance and investment courses.
What the Template Contains
- Historical Data: Includes Enterprise Products Partners L.P.'s (EPD) past financials and baseline forecasts.
- DCF and Levered DCF Models: Detailed templates to calculate Enterprise Products Partners L.P.'s (EPD) intrinsic value.
- WACC Sheet: Pre-built calculations for Weighted Average Cost of Capital.
- Editable Inputs: Modify key drivers like growth rates, EBITDA %, and CAPEX assumptions.
- Quarterly and Annual Statements: A complete breakdown of Enterprise Products Partners L.P.'s (EPD) financials.
- Interactive Dashboard: Visualize valuation results and projections dynamically.
Disclaimer
All information, articles, and product details provided on this website are for general informational and educational purposes only. We do not claim any ownership over, nor do we intend to infringe upon, any trademarks, copyrights, logos, brand names, or other intellectual property mentioned or depicted on this site. Such intellectual property remains the property of its respective owners, and any references here are made solely for identification or informational purposes, without implying any affiliation, endorsement, or partnership.
We make no representations or warranties, express or implied, regarding the accuracy, completeness, or suitability of any content or products presented. Nothing on this website should be construed as legal, tax, investment, financial, medical, or other professional advice. In addition, no part of this site—including articles or product references—constitutes a solicitation, recommendation, endorsement, advertisement, or offer to buy or sell any securities, franchises, or other financial instruments, particularly in jurisdictions where such activity would be unlawful.
All content is of a general nature and may not address the specific circumstances of any individual or entity. It is not a substitute for professional advice or services. Any actions you take based on the information provided here are strictly at your own risk. You accept full responsibility for any decisions or outcomes arising from your use of this website and agree to release us from any liability in connection with your use of, or reliance upon, the content or products found herein.