
|
شركة فرانكلين كوفي (FC) تقييم DCF |
Fully Editable: Tailor To Your Needs In Excel Or Sheets
Professional Design: Trusted, Industry-Standard Templates
Investor-Approved Valuation Models
MAC/PC Compatible, Fully Unlocked
No Expertise Is Needed; Easy To Follow
Franklin Covey Co. (FC) Bundle
استكشف الآفاق المالية لشركة Franklin Covey Co. (FC) باستخدام حاسبة DCF سهلة الاستخدام! أدخل افتراضاتك المتعلقة بالنمو والهوامش والمصروفات لحساب القيمة الجوهرية لشركة فرانكلين كوفي (FC) وتعزيز استراتيجية الاستثمار الخاصة بك.
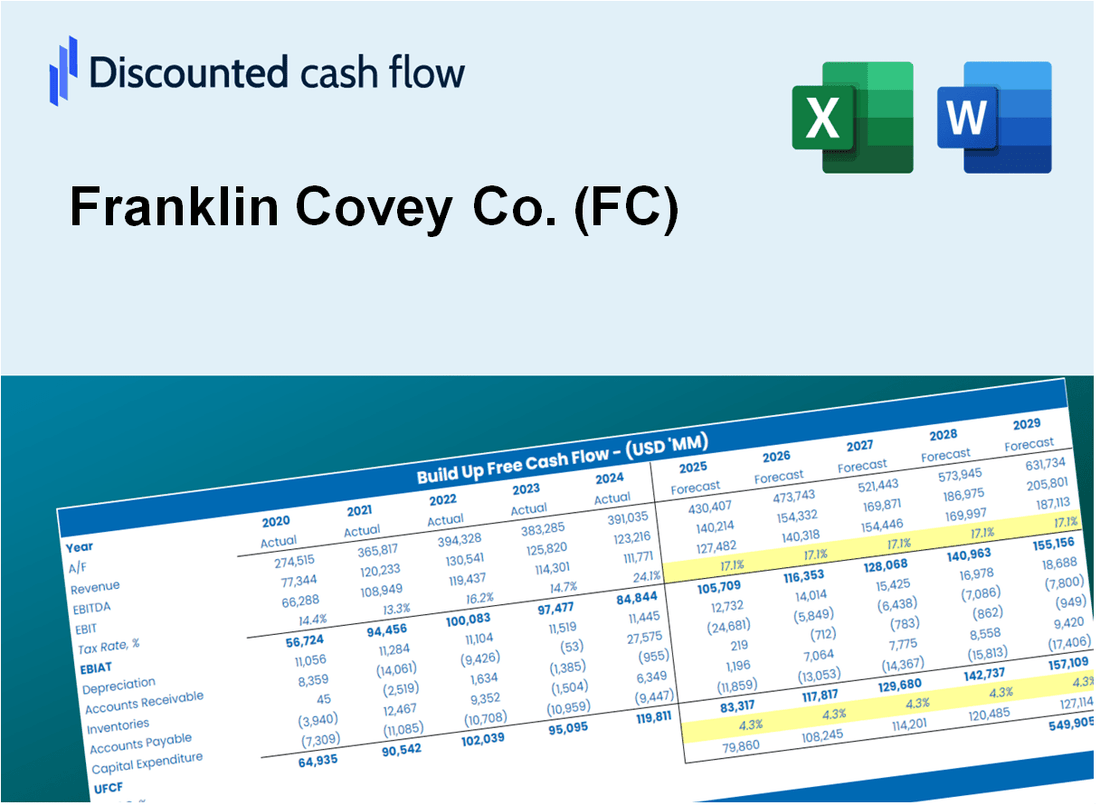
Discounted Cash Flow (DCF) - (USD MM)
| Year | AY1 2020 |
AY2 2021 |
AY3 2022 |
AY4 2023 |
AY5 2024 |
FY1 2025 |
FY2 2026 |
FY3 2027 |
FY4 2028 |
FY5 2029 |
|---|---|---|---|---|---|---|---|---|---|---|
| Revenue | 198.5 | 224.2 | 262.8 | 280.5 | 287.2 | 315.5 | 346.5 | 380.6 | 418.0 | 459.1 |
| Revenue Growth, % | 0 | 12.96 | 17.25 | 6.73 | 2.39 | 9.83 | 9.83 | 9.83 | 9.83 | 9.83 |
| EBITDA | 18.7 | 23.8 | 38.2 | 40.0 | 46.3 | 41.0 | 45.0 | 49.4 | 54.3 | 59.6 |
| EBITDA, % | 9.4 | 10.63 | 14.52 | 14.25 | 16.1 | 12.98 | 12.98 | 12.98 | 12.98 | 12.98 |
| Depreciation | 15.6 | 15.6 | 14.4 | 12.5 | 12.1 | 18.3 | 20.1 | 22.1 | 24.2 | 26.6 |
| Depreciation, % | 7.84 | 6.98 | 5.49 | 4.47 | 4.21 | 5.8 | 5.8 | 5.8 | 5.8 | 5.8 |
| EBIT | 3.1 | 8.2 | 23.7 | 27.5 | 34.2 | 22.7 | 24.9 | 27.3 | 30.0 | 33.0 |
| EBIT, % | 1.57 | 3.65 | 9.03 | 9.79 | 11.89 | 7.19 | 7.19 | 7.19 | 7.19 | 7.19 |
| Total Cash | 27.1 | 47.4 | 60.5 | 38.2 | 48.7 | 55.8 | 61.3 | 67.3 | 73.9 | 81.2 |
| Total Cash, percent | .0 | .0 | .0 | .0 | .0 | .0 | .0 | .0 | .0 | .0 |
| Account Receivables | 56.4 | 70.7 | 72.6 | 81.9 | 86.0 | 92.6 | 101.7 | 111.7 | 122.6 | 134.7 |
| Account Receivables, % | 28.42 | 31.53 | 27.61 | 29.21 | 29.94 | 29.34 | 29.34 | 29.34 | 29.34 | 29.34 |
| Inventories | 3.0 | 2.5 | 3.5 | 4.2 | 4.0 | 4.3 | 4.7 | 5.2 | 5.7 | 6.3 |
| Inventories, % | 1.5 | 1.11 | 1.34 | 1.5 | 1.39 | 1.37 | 1.37 | 1.37 | 1.37 | 1.37 |
| Accounts Payable | 5.6 | 6.9 | 10.9 | 6.5 | 7.9 | 9.5 | 10.5 | 11.5 | 12.6 | 13.9 |
| Accounts Payable, % | 2.83 | 3.1 | 4.13 | 2.32 | 2.74 | 3.02 | 3.02 | 3.02 | 3.02 | 3.02 |
| Capital Expenditure | -9.3 | -4.1 | -5.3 | -13.6 | -3.7 | -9.2 | -10.1 | -11.1 | -12.2 | -13.4 |
| Capital Expenditure, % | -4.67 | -1.83 | -2.03 | -4.83 | -1.29 | -2.93 | -2.93 | -2.93 | -2.93 | -2.93 |
| Tax Rate, % | 29.18 | 29.18 | 29.18 | 29.18 | 29.18 | 29.18 | 29.18 | 29.18 | 29.18 | 29.18 |
| EBITAT | -36.9 | 18.3 | 19.8 | 18.9 | 24.2 | 14.6 | 16.1 | 17.7 | 19.4 | 21.3 |
| Depreciation | ||||||||||
| Changes in Account Receivables | ||||||||||
| Changes in Inventories | ||||||||||
| Changes in Accounts Payable | ||||||||||
| Capital Expenditure | ||||||||||
| UFCF | -84.4 | 17.4 | 29.9 | 3.4 | 30.1 | 18.5 | 17.4 | 19.1 | 21.0 | 23.1 |
| WACC, % | 7.59 | 8.06 | 7.99 | 7.92 | 7.93 | 7.9 | 7.9 | 7.9 | 7.9 | 7.9 |
| PV UFCF | ||||||||||
| SUM PV UFCF | 78.7 | |||||||||
| Long Term Growth Rate, % | 4.00 | |||||||||
| Free cash flow (T + 1) | 24 | |||||||||
| Terminal Value | 617 | |||||||||
| Present Terminal Value | 422 | |||||||||
| Enterprise Value | 500 | |||||||||
| Net Debt | -43 | |||||||||
| Equity Value | 543 | |||||||||
| Diluted Shares Outstanding, MM | 13 | |||||||||
| Equity Value Per Share | 40.31 |
What You Will Get
- Pre-Filled Financial Model: Franklin Covey Co.’s actual data provides a solid foundation for accurate DCF valuation.
- Full Forecast Control: Modify revenue growth, profit margins, WACC, and other essential parameters.
- Instant Calculations: Real-time updates guarantee immediate visibility of results as adjustments are made.
- Investor-Ready Template: A polished Excel file crafted for high-quality valuation presentations.
- Customizable and Reusable: Designed for adaptability, enabling repeated application for comprehensive forecasts.
Key Features
- Comprehensive Data: Franklin Covey Co.'s historical financial statements and pre-filled projections.
- Customizable Inputs: Modify WACC, tax rates, revenue growth, and EBITDA margins as needed.
- Real-Time Results: Observe Franklin Covey Co.'s intrinsic value recalculating instantly.
- Visual Performance Metrics: Dashboard charts illustrate valuation results and essential metrics.
- Designed for Precision: A robust tool for analysts, investors, and finance professionals.
How It Works
- Step 1: Download the prebuilt Excel template with Franklin Covey Co.'s (FC) data included.
- Step 2: Explore the pre-filled sheets and familiarize yourself with the key performance indicators.
- Step 3: Update forecasts and assumptions in the editable yellow cells (WACC, growth, margins).
- Step 4: Instantly view recalculated results, including Franklin Covey Co.'s (FC) intrinsic value.
- Step 5: Make informed investment decisions or generate reports using the outputs.
Why Choose Franklin Covey Co. (FC) Calculator?
- Precision: Utilizes verified Franklin Covey financial data for reliable results.
- Adaptability: Tailored for users to easily alter and experiment with inputs.
- Efficiency: Eliminate the need to create a financial model from the ground up.
- Expert-Level: Crafted with the expertise and user-friendliness expected by executives.
- Intuitive: Simple to navigate, even for those lacking extensive financial modeling skills.
Who Should Use This Product?
- Investors: Accurately assess Franklin Covey Co.’s (FC) fair value prior to making investment choices.
- CFOs: Utilize a professional-grade DCF model for financial reporting and analysis related to Franklin Covey Co. (FC).
- Consultants: Quickly modify the template for valuation reports tailored to Franklin Covey Co. (FC) clients.
- Entrepreneurs: Acquire insights into financial modeling practices employed by leading companies like Franklin Covey Co. (FC).
- Educators: Employ it as a teaching resource to illustrate valuation techniques in relation to Franklin Covey Co. (FC).
What the Template Contains
- Comprehensive DCF Model: Editable template featuring detailed valuation calculations for Franklin Covey Co. (FC).
- Real-World Data: Franklin Covey's historical and projected financials preloaded for thorough analysis.
- Customizable Parameters: Modify WACC, growth rates, and tax assumptions to explore various scenarios.
- Financial Statements: Complete annual and quarterly breakdowns for enhanced insights.
- Key Ratios: Integrated analysis for profitability, efficiency, and leverage metrics.
- Dashboard with Visual Outputs: Charts and tables designed for clear, actionable results.
Disclaimer
All information, articles, and product details provided on this website are for general informational and educational purposes only. We do not claim any ownership over, nor do we intend to infringe upon, any trademarks, copyrights, logos, brand names, or other intellectual property mentioned or depicted on this site. Such intellectual property remains the property of its respective owners, and any references here are made solely for identification or informational purposes, without implying any affiliation, endorsement, or partnership.
We make no representations or warranties, express or implied, regarding the accuracy, completeness, or suitability of any content or products presented. Nothing on this website should be construed as legal, tax, investment, financial, medical, or other professional advice. In addition, no part of this site—including articles or product references—constitutes a solicitation, recommendation, endorsement, advertisement, or offer to buy or sell any securities, franchises, or other financial instruments, particularly in jurisdictions where such activity would be unlawful.
All content is of a general nature and may not address the specific circumstances of any individual or entity. It is not a substitute for professional advice or services. Any actions you take based on the information provided here are strictly at your own risk. You accept full responsibility for any decisions or outcomes arising from your use of this website and agree to release us from any liability in connection with your use of, or reliance upon, the content or products found herein.