
|
Figs ، Inc. (Figs) DCF تقييم |
Fully Editable: Tailor To Your Needs In Excel Or Sheets
Professional Design: Trusted, Industry-Standard Templates
Investor-Approved Valuation Models
MAC/PC Compatible, Fully Unlocked
No Expertise Is Needed; Easy To Follow
FIGS, Inc. (FIGS) Bundle
قم بتحسين وقتك وتحسين الدقة باستخدام حاسبة DCF (FIGS)! مزودة ببيانات حقيقية من Figs ، Inc. والافتراضات القابلة للتخصيص ، هذه الأداة تمكنك من التنبؤ وتحليل وتقييم التين مثل المستثمر المخضرم.
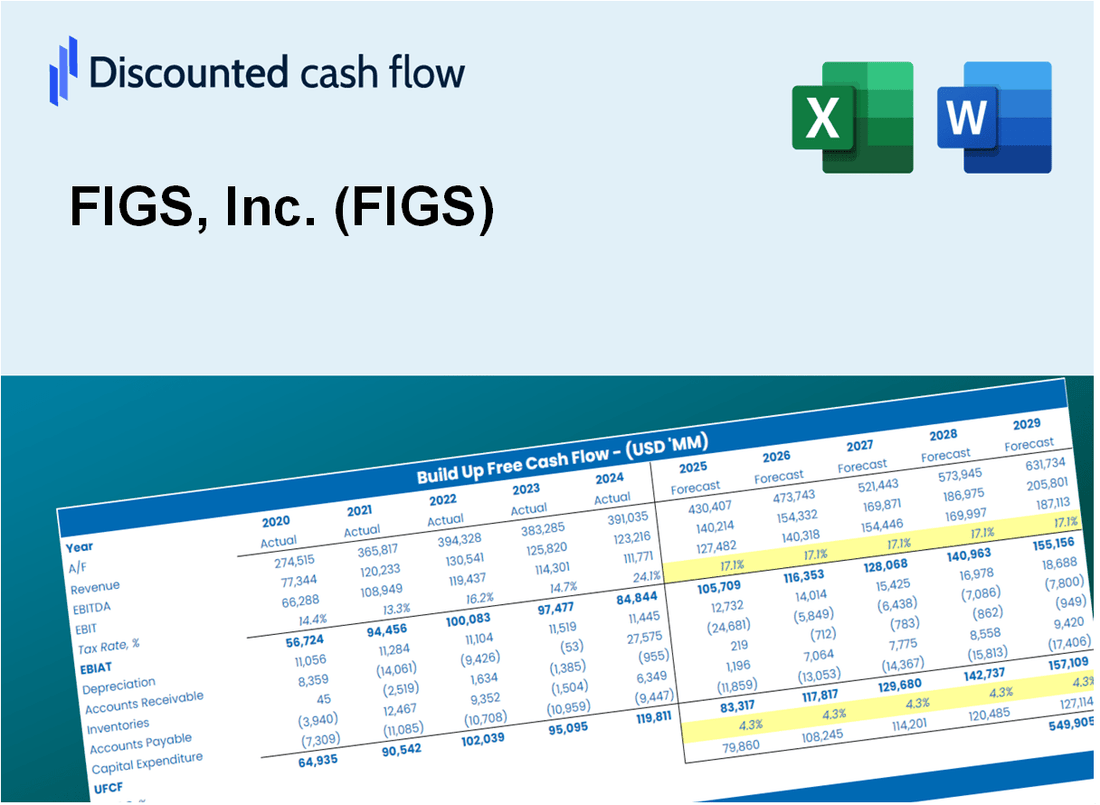
Discounted Cash Flow (DCF) - (USD MM)
| Year | AY1 2020 |
AY2 2021 |
AY3 2022 |
AY4 2023 |
AY5 2024 |
FY1 2025 |
FY2 2026 |
FY3 2027 |
FY4 2028 |
FY5 2029 |
|---|---|---|---|---|---|---|---|---|---|---|
| Revenue | 263.1 | 419.6 | 505.8 | 545.6 | 555.6 | 680.2 | 832.7 | 1,019.5 | 1,248.1 | 1,528.1 |
| Revenue Growth, % | 0 | 59.47 | 20.55 | 7.87 | 1.82 | 22.43 | 22.43 | 22.43 | 22.43 | 22.43 |
| EBITDA | 58.9 | 11.5 | 39.6 | 37.0 | 9.0 | 56.2 | 68.9 | 84.3 | 103.2 | 126.4 |
| EBITDA, % | 22.38 | 2.75 | 7.83 | 6.78 | 1.61 | 8.27 | 8.27 | 8.27 | 8.27 | 8.27 |
| Depreciation | .9 | 1.4 | 1.9 | 2.9 | 6.7 | 3.8 | 4.7 | 5.8 | 7.0 | 8.6 |
| Depreciation, % | 0.35954 | 0.33938 | 0.38036 | 0.53918 | 1.2 | 0.56467 | 0.56467 | 0.56467 | 0.56467 | 0.56467 |
| EBIT | 57.9 | 10.1 | 37.7 | 34.0 | 2.3 | 52.4 | 64.2 | 78.5 | 96.2 | 117.7 |
| EBIT, % | 22.02 | 2.41 | 7.45 | 6.24 | 0.4077 | 7.7 | 7.7 | 7.7 | 7.7 | 7.7 |
| Total Cash | 58.1 | 195.4 | 159.8 | 246.7 | 245.1 | 257.9 | 315.7 | 386.5 | 473.2 | 579.4 |
| Total Cash, percent | .0 | .0 | .0 | .0 | .0 | .0 | .0 | .0 | .0 | .0 |
| Account Receivables | 5.8 | 2.4 | 6.9 | 7.5 | 8.6 | 9.6 | 11.8 | 14.4 | 17.6 | 21.6 |
| Account Receivables, % | 2.2 | 0.58176 | 1.36 | 1.37 | 1.55 | 1.41 | 1.41 | 1.41 | 1.41 | 1.41 |
| Inventories | 49.7 | 86.1 | 178.0 | 119.0 | 115.8 | 159.5 | 195.3 | 239.1 | 292.7 | 358.3 |
| Inventories, % | 18.9 | 20.51 | 35.18 | 21.82 | 20.84 | 23.45 | 23.45 | 23.45 | 23.45 | 23.45 |
| Accounts Payable | 12.0 | 14.6 | 20.9 | 14.7 | 9.4 | 22.5 | 27.6 | 33.8 | 41.3 | 50.6 |
| Accounts Payable, % | 4.55 | 3.48 | 4.13 | 2.7 | 1.69 | 3.31 | 3.31 | 3.31 | 3.31 | 3.31 |
| Capital Expenditure | -2.3 | -2.7 | -5.3 | -16.3 | -17.0 | -11.7 | -14.4 | -17.6 | -21.5 | -26.4 |
| Capital Expenditure, % | -0.85971 | -0.64634 | -1.06 | -3 | -3.06 | -1.72 | -1.72 | -1.72 | -1.72 | -1.72 |
| Tax Rate, % | 81.03 | 81.03 | 81.03 | 81.03 | 81.03 | 81.03 | 81.03 | 81.03 | 81.03 | 81.03 |
| EBITAT | 49.6 | -9.8 | 20.6 | 18.9 | .4 | 22.5 | 27.6 | 33.7 | 41.3 | 50.6 |
| Depreciation | ||||||||||
| Changes in Account Receivables | ||||||||||
| Changes in Inventories | ||||||||||
| Changes in Accounts Payable | ||||||||||
| Capital Expenditure | ||||||||||
| UFCF | 4.8 | -41.4 | -72.8 | 57.7 | -13.1 | -17.0 | -15.0 | -18.3 | -22.4 | -27.5 |
| WACC, % | 9.86 | 9.76 | 9.83 | 9.83 | 9.79 | 9.81 | 9.81 | 9.81 | 9.81 | 9.81 |
| PV UFCF | ||||||||||
| SUM PV UFCF | -74.3 | |||||||||
| Long Term Growth Rate, % | 4.00 | |||||||||
| Free cash flow (T + 1) | -29 | |||||||||
| Terminal Value | -492 | |||||||||
| Present Terminal Value | -308 | |||||||||
| Enterprise Value | -382 | |||||||||
| Net Debt | -33 | |||||||||
| Equity Value | -350 | |||||||||
| Diluted Shares Outstanding, MM | 180 | |||||||||
| Equity Value Per Share | -1.94 |
What You Will Get
- Real FIGS Financials: Access to historical and projected data for precise valuation.
- Customizable Inputs: Adjust WACC, tax rates, revenue growth, and capital expenditures as needed.
- Instant Calculations: Intrinsic value and NPV are automatically updated in real-time.
- Scenario Analysis: Evaluate various scenarios to assess FIGS, Inc.'s future performance.
- User-Friendly Design: Designed for professionals while remaining approachable for newcomers.
Key Features
- Comprehensive DCF Calculator: Offers detailed unlevered and levered DCF valuation models tailored for FIGS, Inc. (FIGS).
- WACC Calculator: Features a pre-built Weighted Average Cost of Capital sheet with customizable inputs specific to FIGS.
- Adjustable Forecast Assumptions: Easily modify growth rates, capital expenditures, and discount rates relevant to FIGS.
- Integrated Financial Ratios: Evaluate profitability, leverage, and efficiency ratios for FIGS, Inc. (FIGS).
- Interactive Dashboard and Charts: Visual outputs provide a summary of key valuation metrics for straightforward analysis of FIGS.
How It Works
- 1. Open the Template: Download and open the Excel file containing FIGS, Inc.'s (FIGS) preloaded data.
- 2. Edit Assumptions: Modify key inputs such as growth rates, WACC, and capital expenditures.
- 3. View Results Instantly: The DCF model automatically calculates intrinsic value and NPV.
- 4. Test Scenarios: Analyze various forecasts to evaluate different valuation outcomes.
- 5. Use with Confidence: Deliver professional valuation insights to back your decisions.
Why Choose This Calculator for FIGS, Inc. (FIGS)?
- User-Friendly Interface: Perfectly crafted for both novices and seasoned users.
- Customizable Inputs: Adjust parameters easily to tailor your financial analysis.
- Real-Time Feedback: Observe immediate updates to FIGS’s valuation as you modify inputs.
- Preloaded Data: Comes with FIGS’s actual financial metrics for swift evaluations.
- Relied Upon by Experts: Trusted by investors and analysts for making educated choices.
Who Should Use FIGS, Inc. (FIGS)?
- Healthcare Professionals: Discover stylish and comfortable scrubs designed for your demanding work environment.
- Fashion-Conscious Medical Staff: Elevate your wardrobe with modern designs that reflect your personal style.
- Hospital Administrators: Enhance team morale by providing high-quality, functional uniforms for staff.
- Students in Healthcare Programs: Prepare for clinical rotations with durable and fashionable scrubs.
- Gift Givers: Surprise loved ones in the medical field with thoughtful and practical apparel.
What the Template Contains
- Preloaded FIGS Data: Historical and projected financial data, including revenue, EBIT, and capital expenditures.
- DCF and WACC Models: Professional-grade sheets for calculating intrinsic value and Weighted Average Cost of Capital.
- Editable Inputs: Yellow-highlighted cells for adjusting revenue growth, tax rates, and discount rates.
- Financial Statements: Comprehensive annual and quarterly financials for deeper analysis.
- Key Ratios: Profitability, leverage, and efficiency ratios to evaluate performance.
- Dashboard and Charts: Visual summaries of valuation outcomes and assumptions.
Disclaimer
All information, articles, and product details provided on this website are for general informational and educational purposes only. We do not claim any ownership over, nor do we intend to infringe upon, any trademarks, copyrights, logos, brand names, or other intellectual property mentioned or depicted on this site. Such intellectual property remains the property of its respective owners, and any references here are made solely for identification or informational purposes, without implying any affiliation, endorsement, or partnership.
We make no representations or warranties, express or implied, regarding the accuracy, completeness, or suitability of any content or products presented. Nothing on this website should be construed as legal, tax, investment, financial, medical, or other professional advice. In addition, no part of this site—including articles or product references—constitutes a solicitation, recommendation, endorsement, advertisement, or offer to buy or sell any securities, franchises, or other financial instruments, particularly in jurisdictions where such activity would be unlawful.
All content is of a general nature and may not address the specific circumstances of any individual or entity. It is not a substitute for professional advice or services. Any actions you take based on the information provided here are strictly at your own risk. You accept full responsibility for any decisions or outcomes arising from your use of this website and agree to release us from any liability in connection with your use of, or reliance upon, the content or products found herein.