
|
Five أدناه ، Inc. (خمسة) تقييم DCF |
Fully Editable: Tailor To Your Needs In Excel Or Sheets
Professional Design: Trusted, Industry-Standard Templates
Investor-Approved Valuation Models
MAC/PC Compatible, Fully Unlocked
No Expertise Is Needed; Easy To Follow
Five Below, Inc. (FIVE) Bundle
تبسيط خمسة أدناه ، Inc. (خمسة) تقييم مع هذه الآلة الحاسبة DCF القابلة للتخصيص! يضم REAL Five أدناه ، Inc. (خمسة) بيانات مالية ومدخلات للتوقعات القابلة للتعديل ، يمكنك اختبار السيناريوهات والكشف عن القيمة العادلة Five أدناه ، Inc. (خمسة) في دقائق.
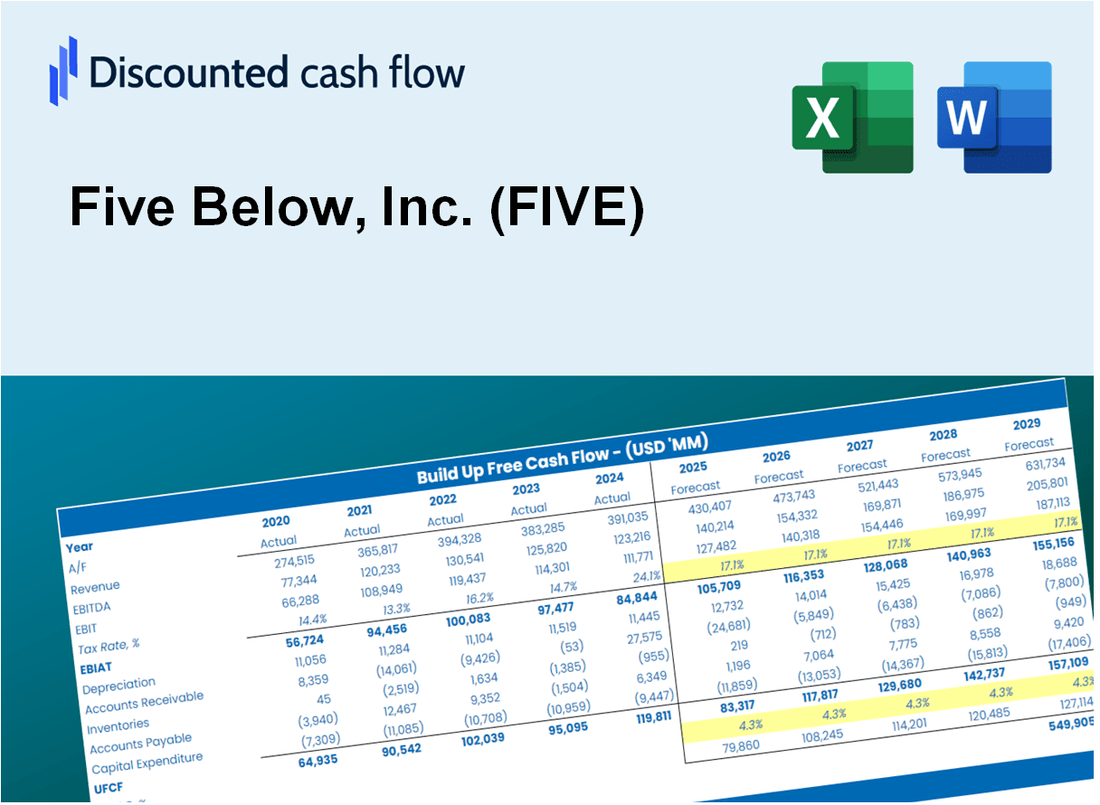
Discounted Cash Flow (DCF) - (USD MM)
| Year | AY1 2020 |
AY2 2021 |
AY3 2022 |
AY4 2023 |
AY5 2024 |
FY1 2025 |
FY2 2026 |
FY3 2027 |
FY4 2028 |
FY5 2029 |
|---|---|---|---|---|---|---|---|---|---|---|
| Revenue | 1,962.1 | 2,848.4 | 3,076.3 | 3,559.4 | 3,876.5 | 4,630.3 | 5,530.7 | 6,606.2 | 7,890.8 | 9,425.2 |
| Revenue Growth, % | 0 | 45.17 | 8 | 15.7 | 8.91 | 19.45 | 19.45 | 19.45 | 19.45 | 19.45 |
| EBITDA | 224.1 | 464.7 | 450.7 | 516.3 | 491.3 | 644.2 | 769.5 | 919.1 | 1,097.9 | 1,311.4 |
| EBITDA, % | 11.42 | 16.32 | 14.65 | 14.51 | 12.67 | 13.91 | 13.91 | 13.91 | 13.91 | 13.91 |
| Depreciation | 69.3 | 84.8 | 105.6 | 130.7 | 167.4 | 166.1 | 198.4 | 237.0 | 283.1 | 338.1 |
| Depreciation, % | 3.53 | 2.98 | 3.43 | 3.67 | 4.32 | 3.59 | 3.59 | 3.59 | 3.59 | 3.59 |
| EBIT | 154.8 | 379.9 | 345.0 | 385.6 | 323.8 | 478.1 | 571.1 | 682.1 | 814.8 | 973.2 |
| EBIT, % | 7.89 | 13.34 | 11.22 | 10.83 | 8.35 | 10.33 | 10.33 | 10.33 | 10.33 | 10.33 |
| Total Cash | 409.7 | 342.1 | 399.2 | 460.1 | 528.8 | 670.8 | 801.2 | 957.0 | 1,143.1 | 1,365.4 |
| Total Cash, percent | .0 | .0 | .0 | .0 | .0 | .0 | .0 | .0 | .0 | .0 |
| Account Receivables | 6.4 | 11.3 | 8.9 | 4.8 | 4.6 | 11.7 | 14.0 | 16.7 | 20.0 | 23.9 |
| Account Receivables, % | 0.32363 | 0.3976 | 0.28924 | 0.13581 | 0.11993 | 0.25324 | 0.25324 | 0.25324 | 0.25324 | 0.25324 |
| Inventories | 281.3 | 455.1 | 527.7 | 584.6 | 659.5 | 749.2 | 894.9 | 1,068.9 | 1,276.8 | 1,525.1 |
| Inventories, % | 14.33 | 15.98 | 17.15 | 16.43 | 17.01 | 16.18 | 16.18 | 16.18 | 16.18 | 16.18 |
| Accounts Payable | 138.6 | 196.5 | 221.1 | 256.3 | 260.3 | 324.7 | 387.9 | 463.3 | 553.4 | 661.0 |
| Accounts Payable, % | 7.06 | 6.9 | 7.19 | 7.2 | 6.72 | 7.01 | 7.01 | 7.01 | 7.01 | 7.01 |
| Capital Expenditure | -200.2 | -288.2 | -252.0 | -335.1 | -324.0 | -428.6 | -511.9 | -611.5 | -730.4 | -872.4 |
| Capital Expenditure, % | -10.2 | -10.12 | -8.19 | -9.41 | -8.36 | -9.26 | -9.26 | -9.26 | -9.26 | -9.26 |
| Tax Rate, % | 25.11 | 25.11 | 25.11 | 25.11 | 25.11 | 25.11 | 25.11 | 25.11 | 25.11 | 25.11 |
| EBITAT | 124.8 | 288.8 | 259.7 | 289.4 | 242.5 | 365.1 | 436.1 | 520.9 | 622.2 | 743.2 |
| Depreciation | ||||||||||
| Changes in Account Receivables | ||||||||||
| Changes in Inventories | ||||||||||
| Changes in Accounts Payable | ||||||||||
| Capital Expenditure | ||||||||||
| UFCF | -155.1 | -35.5 | 67.8 | 67.5 | 15.3 | 70.2 | 37.8 | 45.1 | 53.9 | 64.4 |
| WACC, % | 8.04 | 8.01 | 8 | 8 | 8 | 8.01 | 8.01 | 8.01 | 8.01 | 8.01 |
| PV UFCF | ||||||||||
| SUM PV UFCF | 216.6 | |||||||||
| Long Term Growth Rate, % | 3.50 | |||||||||
| Free cash flow (T + 1) | 67 | |||||||||
| Terminal Value | 1,477 | |||||||||
| Present Terminal Value | 1,005 | |||||||||
| Enterprise Value | 1,221 | |||||||||
| Net Debt | 1,650 | |||||||||
| Equity Value | -429 | |||||||||
| Diluted Shares Outstanding, MM | 55 | |||||||||
| Equity Value Per Share | -7.77 |
What You Will Get
- Editable Forecast Inputs: Easily modify key assumptions (growth %, margins, WACC) to explore various scenarios.
- Real-World Data: Five Below, Inc.'s (FIVE) financial data pre-loaded to kickstart your analysis.
- Automatic DCF Outputs: The template computes Net Present Value (NPV) and intrinsic value automatically.
- Customizable and Professional: A sleek Excel model tailored to meet your valuation requirements.
- Built for Analysts and Investors: Perfect for evaluating projections, validating strategies, and enhancing efficiency.
Key Features
- Real Five Below Financials: Access accurate pre-loaded historical data and future projections.
- Customizable Forecast Assumptions: Edit yellow-highlighted cells such as WACC, growth rates, and margins.
- Dynamic Calculations: Automatic updates to DCF, Net Present Value (NPV), and cash flow analysis.
- Visual Dashboard: Easy-to-read charts and summaries to visualize your valuation results.
- For Professionals and Beginners: A simple, intuitive structure designed for investors, CFOs, and consultants.
How It Works
- Step 1: Download the prebuilt Excel template with Five Below’s data included.
- Step 2: Explore the pre-filled sheets and understand the key metrics.
- Step 3: Update forecasts and assumptions in the editable yellow cells (WACC, growth, margins).
- Step 4: Instantly view recalculated results, including Five Below’s intrinsic value.
- Step 5: Make informed investment decisions or generate reports using the outputs.
Why Choose This Calculator for Five Below, Inc. (FIVE)?
- User-Friendly Interface: Perfectly crafted for both novices and seasoned users.
- Customizable Inputs: Adjust parameters easily to suit your financial analysis.
- Real-Time Feedback: Observe immediate updates to Five Below’s valuation as you tweak inputs.
- Pre-Configured Data: Comes with Five Below’s current financial metrics for swift evaluations.
- Relied Upon by Experts: A go-to tool for investors and analysts seeking data-driven insights.
Who Should Use Five Below, Inc. (FIVE)?
- Retail Investors: Make informed investment choices with insights into a dynamic retail brand.
- Market Analysts: Analyze market trends and consumer behavior specific to discount retail.
- Business Consultants: Tailor strategies for clients looking to enter or expand in the retail sector.
- Brand Enthusiasts: Explore innovative merchandising and marketing tactics used by Five Below.
- Students and Educators: Utilize case studies related to Five Below in business and marketing courses.
What the Template Contains
- Historical Data: Includes Five Below’s past financials and baseline forecasts.
- DCF and Levered DCF Models: Detailed templates to calculate Five Below’s intrinsic value.
- WACC Sheet: Pre-built calculations for Weighted Average Cost of Capital.
- Editable Inputs: Modify key drivers like growth rates, EBITDA %, and CAPEX assumptions.
- Quarterly and Annual Statements: A complete breakdown of Five Below’s financials.
- Interactive Dashboard: Visualize valuation results and projections dynamically.
Disclaimer
All information, articles, and product details provided on this website are for general informational and educational purposes only. We do not claim any ownership over, nor do we intend to infringe upon, any trademarks, copyrights, logos, brand names, or other intellectual property mentioned or depicted on this site. Such intellectual property remains the property of its respective owners, and any references here are made solely for identification or informational purposes, without implying any affiliation, endorsement, or partnership.
We make no representations or warranties, express or implied, regarding the accuracy, completeness, or suitability of any content or products presented. Nothing on this website should be construed as legal, tax, investment, financial, medical, or other professional advice. In addition, no part of this site—including articles or product references—constitutes a solicitation, recommendation, endorsement, advertisement, or offer to buy or sell any securities, franchises, or other financial instruments, particularly in jurisdictions where such activity would be unlawful.
All content is of a general nature and may not address the specific circumstances of any individual or entity. It is not a substitute for professional advice or services. Any actions you take based on the information provided here are strictly at your own risk. You accept full responsibility for any decisions or outcomes arising from your use of this website and agree to release us from any liability in connection with your use of, or reliance upon, the content or products found herein.