
|
Gillette India Limited (Gillette.ns) تقييم DCF |
Fully Editable: Tailor To Your Needs In Excel Or Sheets
Professional Design: Trusted, Industry-Standard Templates
Investor-Approved Valuation Models
MAC/PC Compatible, Fully Unlocked
No Expertise Is Needed; Easy To Follow
Gillette India Limited (GILLETTE.NS) Bundle
تبسيط Gillette India Limited تقييم مع هذه الآلة الحاسبة DCF القابلة للتخصيص! يتميز Gillette India المحدودة بالمواد المالية المحدودة والمدخلات المتوقعة القابلة للتعديل ، يمكنك اختبار السيناريوهات وكشف Gillette India Limited Limited Limited في دقائق.
ماذا ستتلقى
- مدخلات التنبؤ القابلة للتعديل: تعديل الافتراضات بسهولة (النمو ٪ ، الهوامش ، WACC) لإنشاء سيناريوهات مختلفة.
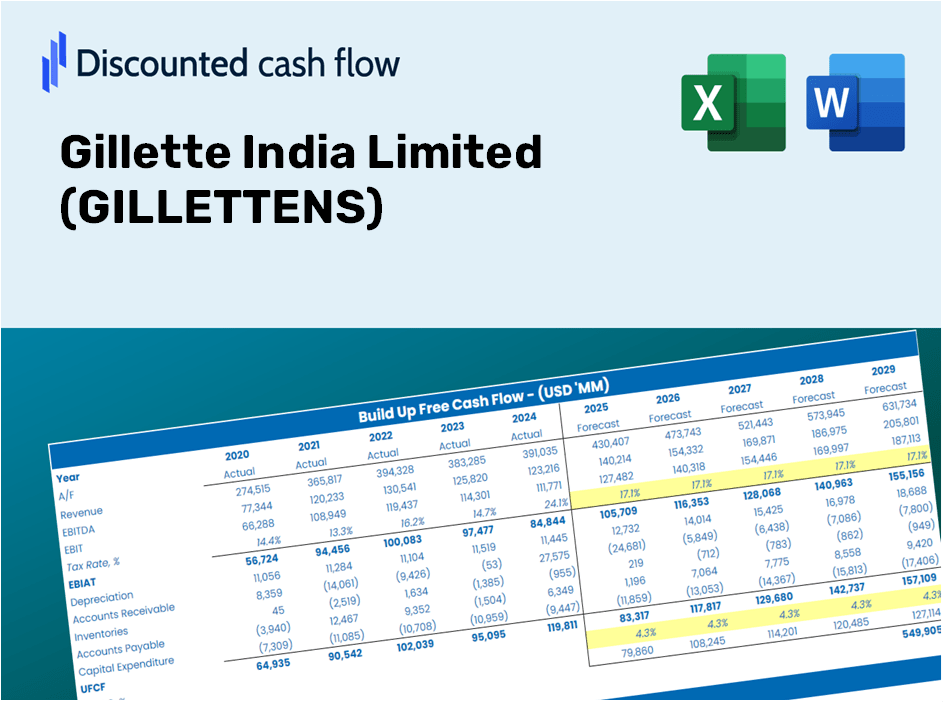
- بيانات العالم الحقيقي: Gillette India Limited's (GILLETTENS) financial data pre-filled to kickstart your analysis.
- مخرجات DCF التلقائية: يقوم القالب بحساب القيمة الحالية الصافية (NPV) والقيمة الجوهرية لك.
- قابل للتخصيص والمهني: نموذج Excel المكرر الذي يلبي متطلبات التقييم الخاصة بك.
- مصمم للمحللين والمستثمرين: مثالي لتقييم التوقعات ، والتحقق من صحة الاستراتيجيات ، وتعزيز الكفاءة.
الميزات الرئيسية
- البيانات التي تم تحميلها مسبقًا: البيانات المالية التاريخية والتوقعات المليئة مسبقًا لـ Gillette India Limited (Gillettens).
- مدخلات قابلة للتعديل بالكامل: تخصيص WACC ، ومعدلات الضرائب ، ونمو الإيرادات ، وهامش الأرباح قبل الفوائد والضرائب والإهلاك والاستهلاك.
- النتائج الفورية: شاهد القيمة الجوهرية لتحديث Gillette India Limited (Gillettens) في الوقت الفعلي.
- واضحة المخرجات المرئية: تقدم مخططات لوحة القيادة نتائج التقييم والمقاييس الأساسية.
- بنيت للدقة: أداة احترافية من الدرجة المهنية مصممة للمحللين والمستثمرين والمهنيين الماليين.
كيف يعمل
- الخطوة 1: قم بتنزيل جدول بيانات Excel.
- الخطوة 2: افحص البيانات المعبأة مسبقًا لشركة Gillette India Limited (GILLETTENS)، بما في ذلك المعلومات التاريخية والمتوقعة.
- الخطوة 3: قم بتعديل الافتراضات الرئيسية (المميزة في الخلايا الصفراء) وفقًا لتحليلك.
- الخطوة 4: لاحظ عمليات إعادة الحساب التلقائية للقيمة الجوهرية لشركة Gillette India Limited (GILLETTENS).
- الخطوة 5: استخدم النتائج لاستراتيجيات الاستثمار الخاصة بك أو احتياجات الإبلاغ.
لماذا تختار هذه الآلة الحاسبة؟
- بيانات موثوقة: الاستفادة من Gillette India المحدودة الأصلية لنتائج التقييم التي يمكن الاعتماد عليها.
- مصممة خصيصًا: قم بتعديل المدخلات الأساسية مثل معدلات النمو ، و WACC ، ومعدلات الضرائب لتتماشى مع توقعاتك.
- زيادة الكفاءة: توفر لك الحسابات المدمجة متاعب البدء من الألف إلى الياء.
- الجودة المهنية: Crafted for investors, analysts, and consultants targeting (GILLETTENS).
- تصميم سهل الاستخدام: An intuitive interface with clear, step-by-step guidance ensures ease of use for everyone.
من يستطيع الاستفادة من جيليت إنديا المحدودة (جيليتنز) ؟
- المستثمرون: قم باستثمارات مستنيرة مع رؤى حول أداء العلامة التجارية الموثوقة.
- محللو السوق: اكتساب الكفاءة من خلال البيانات الشاملة واتجاهات السوق للتحليل.
- مستشارو العلامة التجارية: قم بتخصيص العروض التقديمية بسهولة لعرض استراتيجيات سوق Gillette India.
- عشاق المنتجات: عزز معرفتك بمنتجات الاستمالة وسلوك المستهلك.
- الطلاب والمربون: استخدام الموارد لفهم عملي للتسويق والتمويل في قطاع السلع الاستهلاكية.
مكونات القالب
- البيانات المليئة مسبقا: يحتوي على البيانات المالية التاريخية لـ Gillette India Limited.
- نموذج التدفق النقدي المخفض: نموذج تقييم DCF قابل للتحرير يتميز بحسابات تلقائية.
- متوسط تكلفة رأس المال المرجح (WACC): ورقة عمل مخصصة لحساب WACC استنادًا إلى المدخلات المعرفة من قبل المستخدم.
- النسب المالية الرئيسية: تقييم مقاييس Gillette India Limited والكفاءة والرافعة المالية.
- مدخلات قابلة للتخصيص: بسهولة تعديل نمو الإيرادات ، هوامش الربح ، ومعدلات الضرائب.
- لوحة القيادة الصافية: التمثيلات المرئية والجداول تلخص نتائج التقييم الأساسية.
Disclaimer
All information, articles, and product details provided on this website are for general informational and educational purposes only. We do not claim any ownership over, nor do we intend to infringe upon, any trademarks, copyrights, logos, brand names, or other intellectual property mentioned or depicted on this site. Such intellectual property remains the property of its respective owners, and any references here are made solely for identification or informational purposes, without implying any affiliation, endorsement, or partnership.
We make no representations or warranties, express or implied, regarding the accuracy, completeness, or suitability of any content or products presented. Nothing on this website should be construed as legal, tax, investment, financial, medical, or other professional advice. In addition, no part of this site—including articles or product references—constitutes a solicitation, recommendation, endorsement, advertisement, or offer to buy or sell any securities, franchises, or other financial instruments, particularly in jurisdictions where such activity would be unlawful.
All content is of a general nature and may not address the specific circumstances of any individual or entity. It is not a substitute for professional advice or services. Any actions you take based on the information provided here are strictly at your own risk. You accept full responsibility for any decisions or outcomes arising from your use of this website and agree to release us from any liability in connection with your use of, or reliance upon, the content or products found herein.