
|
Gillette India Limited (Gillette.NS) Évaluation DCF |
Entièrement Modifiable: Adapté À Vos Besoins Dans Excel Ou Sheets
Conception Professionnelle: Modèles Fiables Et Conformes Aux Normes Du Secteur
Pré-Construits Pour Une Utilisation Rapide Et Efficace
Compatible MAC/PC, entièrement débloqué
Aucune Expertise N'Est Requise; Facile À Suivre
Gillette India Limited (GILLETTE.NS) Bundle
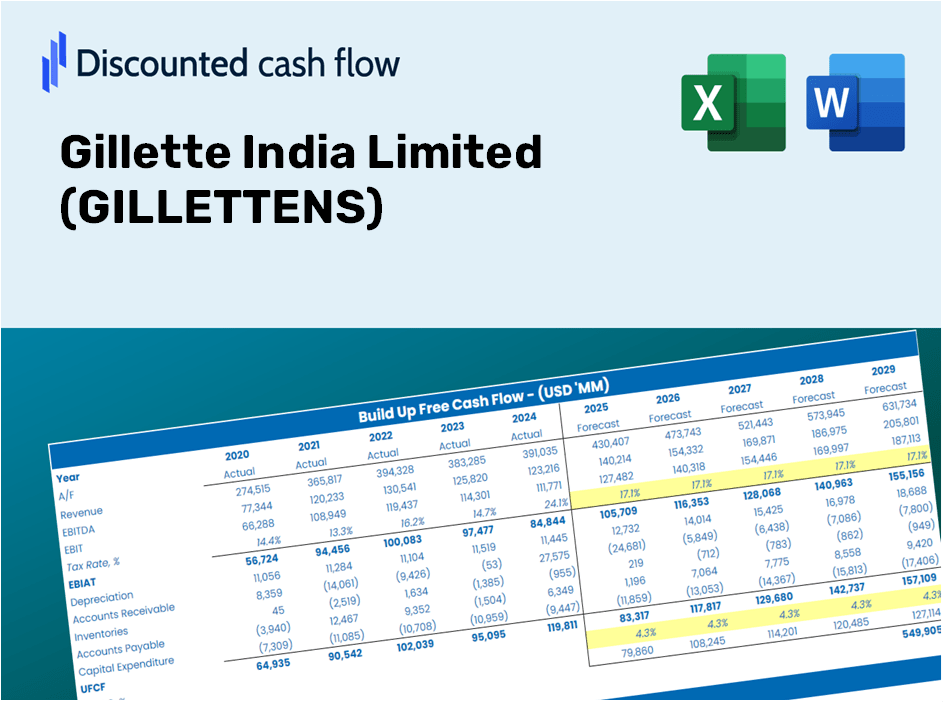
Simplifier Gillette India Limited Valuation avec cette calculatrice DCF personnalisable! Doté de Real Gillette India Limited Financials et des intrants de prévision ajustés, vous pouvez tester des scénarios et découvrir la juste valeur de Gillette India Limited en procès-verbal.
What You Will Receive
- Adjustable Forecast Inputs: Easily modify assumptions (growth %, margins, WACC) to generate various scenarios.
- Real-World Data: Gillette India Limited's (GILLETTENS) financial data pre-filled to kickstart your analysis.
- Automatic DCF Outputs: The template computes Net Present Value (NPV) and intrinsic value for you.
- Customizable and Professional: A refined Excel model that caters to your valuation requirements.
- Designed for Analysts and Investors: Perfect for evaluating projections, validating strategies, and enhancing efficiency.
Key Features
- Pre-Loaded Data: Historical financial statements and pre-filled forecasts for Gillette India Limited (GILLETTENS).
- Fully Adjustable Inputs: Customize WACC, tax rates, revenue growth, and EBITDA margins.
- Instant Results: Watch the intrinsic value of Gillette India Limited (GILLETTENS) update in real time.
- Clear Visual Outputs: Dashboard charts present valuation results and essential metrics.
- Built for Accuracy: A professional-grade tool tailored for analysts, investors, and finance professionals.
How It Functions
- Step 1: Download the Excel spreadsheet.
- Step 2: Examine the pre-filled data for Gillette India Limited (GILLETTENS), including historical and forecasted information.
- Step 3: Modify key assumptions (highlighted in yellow cells) according to your analysis.
- Step 4: Observe the automatic recalculations for Gillette India Limited's (GILLETTENS) intrinsic value.
- Step 5: Utilize the results for your investment strategies or reporting needs.
Why Opt for This Calculator?
- Reliable Data: Utilize authentic Gillette India Limited financials for dependable valuation outcomes.
- Tailor-Made: Modify essential inputs such as growth rates, WACC, and tax rates to align with your forecasts.
- Efficiency Boost: Built-in calculations save you the hassle of starting from the ground up.
- Professional Quality: Crafted for investors, analysts, and consultants targeting (GILLETTENS).
- User-Friendly Design: An intuitive interface with clear, step-by-step guidance ensures ease of use for everyone.
Who Can Benefit from Gillette India Limited (GILLETTENS)?
- Investors: Make informed investments with insights into a trusted brand's performance.
- Market Analysts: Gain efficiency with comprehensive data and market trends for analysis.
- Brand Consultants: Easily customize presentations to showcase Gillette India's market strategies.
- Product Enthusiasts: Enhance your knowledge of grooming products and consumer behavior.
- Students and Educators: Utilize resources for a practical understanding of marketing and finance in the consumer goods sector.
Components of the Template
- Pre-Filled Data: Contains Gillette India Limited's historical financial data and projections.
- Discounted Cash Flow Model: An editable DCF valuation model featuring automatic calculations.
- Weighted Average Cost of Capital (WACC): A dedicated worksheet for WACC calculation based on user-defined inputs.
- Key Financial Ratios: Evaluate Gillette India Limited's profitability, efficiency, and leverage metrics.
- Customizable Inputs: Easily modify revenue growth, profit margins, and tax rates.
- Clear Dashboard: Visual representations and tables summarizing essential valuation outcomes.
Disclaimer
All information, articles, and product details provided on this website are for general informational and educational purposes only. We do not claim any ownership over, nor do we intend to infringe upon, any trademarks, copyrights, logos, brand names, or other intellectual property mentioned or depicted on this site. Such intellectual property remains the property of its respective owners, and any references here are made solely for identification or informational purposes, without implying any affiliation, endorsement, or partnership.
We make no representations or warranties, express or implied, regarding the accuracy, completeness, or suitability of any content or products presented. Nothing on this website should be construed as legal, tax, investment, financial, medical, or other professional advice. In addition, no part of this site—including articles or product references—constitutes a solicitation, recommendation, endorsement, advertisement, or offer to buy or sell any securities, franchises, or other financial instruments, particularly in jurisdictions where such activity would be unlawful.
All content is of a general nature and may not address the specific circumstances of any individual or entity. It is not a substitute for professional advice or services. Any actions you take based on the information provided here are strictly at your own risk. You accept full responsibility for any decisions or outcomes arising from your use of this website and agree to release us from any liability in connection with your use of, or reliance upon, the content or products found herein.