
|
Go Fashion Limited (gocolors.ns) تقييم DCF |
Fully Editable: Tailor To Your Needs In Excel Or Sheets
Professional Design: Trusted, Industry-Standard Templates
Investor-Approved Valuation Models
MAC/PC Compatible, Fully Unlocked
No Expertise Is Needed; Easy To Follow
Go Fashion (India) Limited (GOCOLORS.NS) Bundle
استكشف المستقبل المالي لـ GO Fashion (India) محدودة مع حاسبة DCF سهلة الاستخدام! أدخل توقعاتك على النمو والهوامش والمصروفات لحساب القيمة الجوهرية للأزياء GO (الهند) المحدودة وصقل نهج الاستثمار الخاص بك.
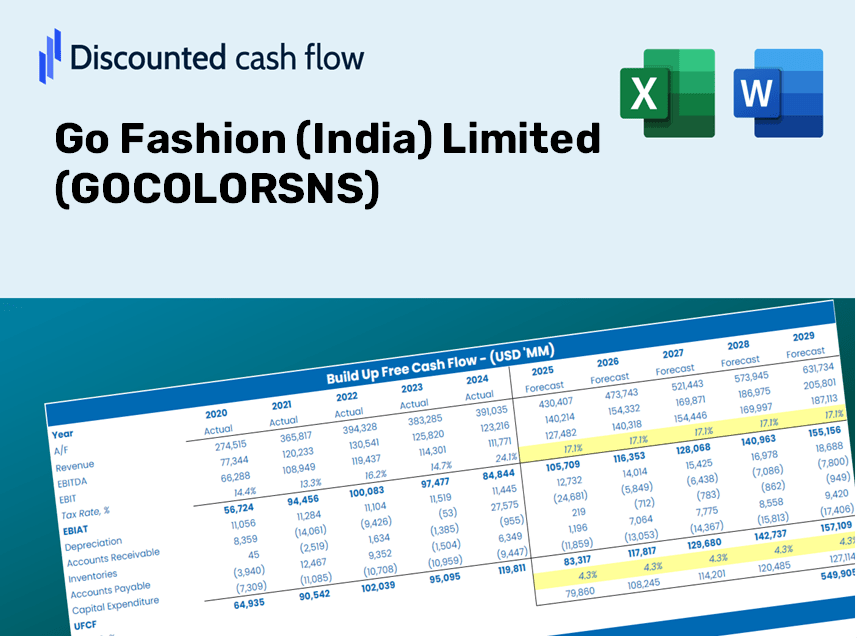
Discounted Cash Flow (DCF) - (USD MM)
| Year | AY1 2021 |
AY2 2022 |
AY3 2023 |
AY4 2024 |
AY5 2025 |
FY1 2026 |
FY2 2027 |
FY3 2028 |
FY4 2029 |
FY5 2030 |
|---|---|---|---|---|---|---|---|---|---|---|
| Revenue | 2,500.3 | 3,997.8 | 6,652.8 | 7,628.3 | 8,481.7 | 9,047.2 | 9,650.4 | 10,293.9 | 10,980.2 | 11,712.3 |
| Revenue Growth, % | 0 | 59.89 | 66.41 | 14.66 | 11.19 | 6.67 | 6.67 | 6.67 | 6.67 | 6.67 |
| EBITDA | 789.0 | 1,409.9 | 2,265.9 | 2,628.7 | 2,679.6 | 3,020.6 | 3,222.0 | 3,436.9 | 3,666.0 | 3,910.4 |
| EBITDA, % | 31.56 | 35.27 | 34.06 | 34.46 | 31.59 | 33.39 | 33.39 | 33.39 | 33.39 | 33.39 |
| Depreciation | 605.0 | 686.1 | 870.5 | 1,103.8 | 1,236.9 | 1,510.8 | 1,611.6 | 1,719.0 | 1,833.6 | 1,955.9 |
| Depreciation, % | 24.2 | 17.16 | 13.09 | 14.47 | 14.58 | 16.7 | 16.7 | 16.7 | 16.7 | 16.7 |
| EBIT | 184.0 | 723.9 | 1,395.3 | 1,524.9 | 1,442.6 | 1,509.8 | 1,610.5 | 1,717.9 | 1,832.4 | 1,954.6 |
| EBIT, % | 7.36 | 18.11 | 20.97 | 19.99 | 17.01 | 16.69 | 16.69 | 16.69 | 16.69 | 16.69 |
| Total Cash | 860.9 | 1,387.3 | 1,026.4 | 1,962.7 | 2,480.5 | 2,524.8 | 2,693.2 | 2,872.7 | 3,064.3 | 3,268.6 |
| Total Cash, percent | .0 | .0 | .0 | .0 | .0 | .0 | .0 | .0 | .0 | .0 |
| Account Receivables | 471.4 | 604.0 | 722.1 | 793.2 | 1,057.3 | 1,224.6 | 1,306.3 | 1,393.4 | 1,486.3 | 1,585.4 |
| Account Receivables, % | 18.85 | 15.11 | 10.85 | 10.4 | 12.47 | 13.54 | 13.54 | 13.54 | 13.54 | 13.54 |
| Inventories | 809.5 | 1,659.2 | 2,303.1 | 2,163.5 | 2,376.5 | 2,983.3 | 3,182.3 | 3,394.4 | 3,620.8 | 3,862.2 |
| Inventories, % | 32.37 | 41.5 | 34.62 | 28.36 | 28.02 | 32.98 | 32.98 | 32.98 | 32.98 | 32.98 |
| Accounts Payable | 113.3 | 183.4 | 156.0 | 368.2 | 315.6 | 362.1 | 386.2 | 412.0 | 439.4 | 468.7 |
| Accounts Payable, % | 4.53 | 4.59 | 2.34 | 4.83 | 3.72 | 4 | 4 | 4 | 4 | 4 |
| Capital Expenditure | -100.3 | -198.6 | -350.8 | -434.1 | -401.1 | -446.4 | -476.2 | -507.9 | -541.8 | -577.9 |
| Capital Expenditure, % | -4.01 | -4.97 | -5.27 | -5.69 | -4.73 | -4.93 | -4.93 | -4.93 | -4.93 | -4.93 |
| Tax Rate, % | 24.17 | 24.17 | 24.17 | 24.17 | 24.17 | 24.17 | 24.17 | 24.17 | 24.17 | 24.17 |
| EBITAT | 207.7 | 538.3 | 1,063.0 | 1,145.2 | 1,093.9 | 1,212.3 | 1,293.1 | 1,379.3 | 1,471.3 | 1,569.4 |
| Depreciation | ||||||||||
| Changes in Account Receivables | ||||||||||
| Changes in Inventories | ||||||||||
| Changes in Accounts Payable | ||||||||||
| Capital Expenditure | ||||||||||
| UFCF | -455.1 | 113.6 | 793.3 | 2,095.6 | 1,400.1 | 1,549.0 | 2,172.1 | 2,316.9 | 2,471.4 | 2,636.2 |
| WACC, % | 5.22 | 4.93 | 4.95 | 4.93 | 4.94 | 5 | 5 | 5 | 5 | 5 |
| PV UFCF | ||||||||||
| SUM PV UFCF | 9,546.8 | |||||||||
| Long Term Growth Rate, % | 4.00 | |||||||||
| Free cash flow (T + 1) | 2,742 | |||||||||
| Terminal Value | 275,454 | |||||||||
| Present Terminal Value | 215,874 | |||||||||
| Enterprise Value | 225,421 | |||||||||
| Net Debt | 2,687 | |||||||||
| Equity Value | 222,734 | |||||||||
| Diluted Shares Outstanding, MM | 54 | |||||||||
| Equity Value Per Share | 4,123.64 |
ماذا ستتلقى
- البيانات المالية gocolorsns الأصلية: مملوءة مسبقًا بأرقام Go Fashion التاريخية والمتوقعة للتحليل الدقيق.
- قالب قابل للتخصيص تمامًا: بسهولة ضبط المقاييس الرئيسية مثل نمو الإيرادات ، WACC ، و EBITDA ٪.
- الحسابات الفورية: شاهد تحديثات في الوقت الفعلي للقيمة الجوهرية لـ Go Fashion أثناء قيامك بإجراء تعديلات.
- أداة التقييم المهنية: مثالية للمستثمرين والمحللين والمستشارين بحثًا عن نتائج DCF الموثوقة.
- تصميم سهل الاستخدام: تصميم مباشر وتوجيه واضح مناسب لجميع مستويات الخبرة.
الميزات الرئيسية
- 🔍 واقعية Gocolorsns المالية: البيانات التاريخية والمتوقعة المليئة مسبقًا بـ GO Fashion (India) Limited.
- ✏️ مدخلات قابلة للتخصيص بالكامل: اضبط جميع المعلمات الهامة (الخلايا الصفراء) مثل WACC و Growth ٪ ومعدلات الضرائب.
- 📊 تقييم DCF المهني: الصيغ المدمجة حساب القيمة الجوهرية لـ GO Fashion باستخدام طريقة التدفق النقدي المخفض.
- ⚡ النتائج الفورية: تصور تقييم GO FASHION مباشرة بعد إجراء التعديلات.
- تحليل السيناريو: اختبار ومقارنة النتائج لمختلف الافتراضات المالية جنبًا إلى جنب.
كيف تعمل
- الخطوة 1: قم بتنزيل قالب Excel Prebuilt الذي يضم بيانات Go Fashion (India) Limited's [Gocolorsns].
- الخطوة 2: انتقل عبر الأوراق المملوءة مسبقًا للتعرف على المقاييس الأساسية.
- الخطوة 3: ضبط التوقعات والافتراضات في الخلايا الصفراء القابلة للتحرير (WACC ، النمو ، الهوامش).
- الخطوة 4: راقب على الفور النتائج المعاد حسابها ، بما في ذلك القيمة الجوهرية لـ GO Fashion.
- الخطوة 5: اتخاذ خيارات استثمار مستنيرة أو إنشاء تقارير بناءً على المخرجات.
لماذا تختار هذه الآلة الحاسبة لـ GO Fashion (India) Limited (Gocolorsns)؟
- تصميم سهل الاستخدام: مصممة لكل من المبتدئين والمستخدمين المحنك.
- مدخلات قابلة للتخصيص: تعديل المعلمات دون عناء لتناسب تحليلك المالي.
- التعديلات في الوقت الحقيقي: شاهد تغيير تقييم Go Fashion على الفور أثناء تعديل البيانات.
- البيانات المحملة مسبقًا: يأتي مع المقاييس المالية الحالية لـ Go Fashion للرؤى العاجلة.
- اعتمد عليه الخبراء: بفضل المستثمرين والمحللين الماليين لاتخاذ القرارات المستنيرة.
من يمكنه الاستفادة من هذا المنتج؟
- المستثمرون: تقييم تقييم GO Fashion (India) Limited (Gocolorsns) قبل إجراء صفقات الأسهم.
- الماليين والمحللين الماليين: تعزيز تدفقات سير العمل وتقييم التوقعات المالية.
- مؤسسو الشركات الناشئة: اكتشف كيف يتم تقييم الشركات العامة الرائدة مثل Go Go Fashion (India) Limited.
- الاستشاريون: تقديم تقارير تقييم مفصلة لعملائك بناءً على gocolorsns.
- الطلاب والمعلمين: الاستفادة من أمثلة في العالم الحقيقي لممارسة وتدريس أساليب التقييم.
ما يتضمنه القالب
- البيانات المليئة مسبقا: يحتوي على بيانات GO FASHION (GOCOLORSNS) المالية والتوقعات التاريخية.
- نموذج التدفق النقدي المخفض: نموذج تقييم DCF قابل للتحرير مع الحسابات التلقائية.
- متوسط تكلفة رأس المال المرجح (WACC): ورقة عمل مخصصة لحساب WACC باستخدام مدخلات قابلة للتخصيص.
- النسب المالية الرئيسية: تقييم ربحية Go Fashion والكفاءة والرافعة المالية.
- مدخلات قابلة للتخصيص: تعديل معدلات نمو الإيرادات بسهولة ، هوامش الربح ، ومعدلات الضرائب.
- لوحة القيادة الصافية: التمثيلات المرئية والجداول تلخص نتائج التقييم الأساسية.
Disclaimer
All information, articles, and product details provided on this website are for general informational and educational purposes only. We do not claim any ownership over, nor do we intend to infringe upon, any trademarks, copyrights, logos, brand names, or other intellectual property mentioned or depicted on this site. Such intellectual property remains the property of its respective owners, and any references here are made solely for identification or informational purposes, without implying any affiliation, endorsement, or partnership.
We make no representations or warranties, express or implied, regarding the accuracy, completeness, or suitability of any content or products presented. Nothing on this website should be construed as legal, tax, investment, financial, medical, or other professional advice. In addition, no part of this site—including articles or product references—constitutes a solicitation, recommendation, endorsement, advertisement, or offer to buy or sell any securities, franchises, or other financial instruments, particularly in jurisdictions where such activity would be unlawful.
All content is of a general nature and may not address the specific circumstances of any individual or entity. It is not a substitute for professional advice or services. Any actions you take based on the information provided here are strictly at your own risk. You accept full responsibility for any decisions or outcomes arising from your use of this website and agree to release us from any liability in connection with your use of, or reliance upon, the content or products found herein.