
|
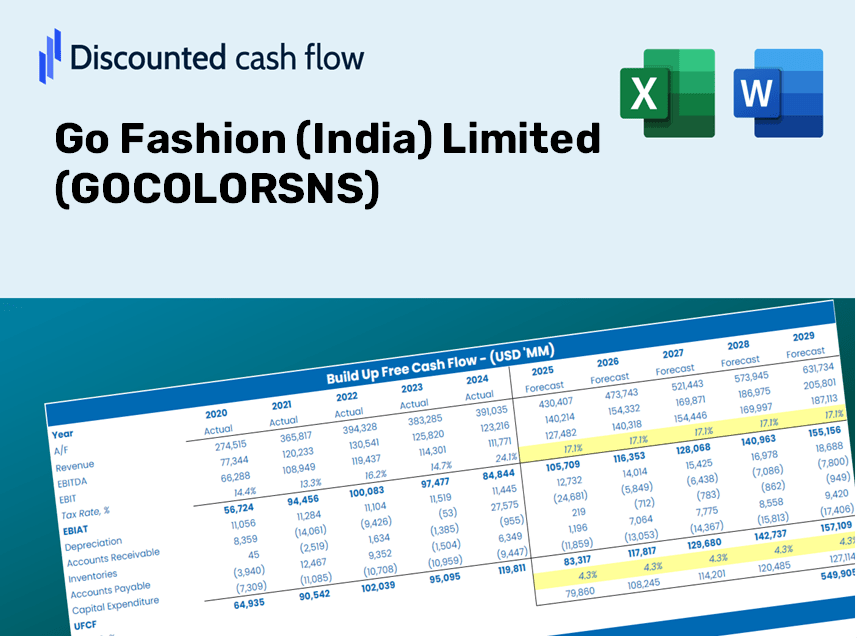
Go Fashion Limited (Gocolors.NS) DCF -Bewertung |
Fully Editable: Tailor To Your Needs In Excel Or Sheets
Professional Design: Trusted, Industry-Standard Templates
Investor-Approved Valuation Models
MAC/PC Compatible, Fully Unlocked
No Expertise Is Needed; Easy To Follow
Go Fashion (India) Limited (GOCOLORS.NS) Bundle
Entdecken Sie die finanzielle Zukunft von Go Fashion (Indien), die mit unserem benutzerfreundlichen DCF-Taschenrechner begrenzt sind! Geben Sie Ihre Prognosen für Wachstum, Margen und Ausgaben ein, um den inneren Wert von Go Fashion (Indien) begrenzt zu berechnen und Ihren Investitionsansatz zu verfeinern.
Discounted Cash Flow (DCF) - (USD MM)
| Year | AY1 2021 |
AY2 2022 |
AY3 2023 |
AY4 2024 |
AY5 2025 |
FY1 2026 |
FY2 2027 |
FY3 2028 |
FY4 2029 |
FY5 2030 |
|---|---|---|---|---|---|---|---|---|---|---|
| Revenue | 2,500.3 | 3,997.8 | 6,652.8 | 7,628.3 | 8,481.7 | 9,047.2 | 9,650.4 | 10,293.9 | 10,980.2 | 11,712.3 |
| Revenue Growth, % | 0 | 59.89 | 66.41 | 14.66 | 11.19 | 6.67 | 6.67 | 6.67 | 6.67 | 6.67 |
| EBITDA | 789.0 | 1,409.9 | 2,265.9 | 2,628.7 | 2,679.6 | 3,020.6 | 3,222.0 | 3,436.9 | 3,666.0 | 3,910.4 |
| EBITDA, % | 31.56 | 35.27 | 34.06 | 34.46 | 31.59 | 33.39 | 33.39 | 33.39 | 33.39 | 33.39 |
| Depreciation | 605.0 | 686.1 | 870.5 | 1,103.8 | 1,236.9 | 1,510.8 | 1,611.6 | 1,719.0 | 1,833.6 | 1,955.9 |
| Depreciation, % | 24.2 | 17.16 | 13.09 | 14.47 | 14.58 | 16.7 | 16.7 | 16.7 | 16.7 | 16.7 |
| EBIT | 184.0 | 723.9 | 1,395.3 | 1,524.9 | 1,442.6 | 1,509.8 | 1,610.5 | 1,717.9 | 1,832.4 | 1,954.6 |
| EBIT, % | 7.36 | 18.11 | 20.97 | 19.99 | 17.01 | 16.69 | 16.69 | 16.69 | 16.69 | 16.69 |
| Total Cash | 860.9 | 1,387.3 | 1,026.4 | 1,962.7 | 2,480.5 | 2,524.8 | 2,693.2 | 2,872.7 | 3,064.3 | 3,268.6 |
| Total Cash, percent | .0 | .0 | .0 | .0 | .0 | .0 | .0 | .0 | .0 | .0 |
| Account Receivables | 471.4 | 604.0 | 722.1 | 793.2 | 1,057.3 | 1,224.6 | 1,306.3 | 1,393.4 | 1,486.3 | 1,585.4 |
| Account Receivables, % | 18.85 | 15.11 | 10.85 | 10.4 | 12.47 | 13.54 | 13.54 | 13.54 | 13.54 | 13.54 |
| Inventories | 809.5 | 1,659.2 | 2,303.1 | 2,163.5 | 2,376.5 | 2,983.3 | 3,182.3 | 3,394.4 | 3,620.8 | 3,862.2 |
| Inventories, % | 32.37 | 41.5 | 34.62 | 28.36 | 28.02 | 32.98 | 32.98 | 32.98 | 32.98 | 32.98 |
| Accounts Payable | 113.3 | 183.4 | 156.0 | 368.2 | 315.6 | 362.1 | 386.2 | 412.0 | 439.4 | 468.7 |
| Accounts Payable, % | 4.53 | 4.59 | 2.34 | 4.83 | 3.72 | 4 | 4 | 4 | 4 | 4 |
| Capital Expenditure | -100.3 | -198.6 | -350.8 | -434.1 | -401.1 | -446.4 | -476.2 | -507.9 | -541.8 | -577.9 |
| Capital Expenditure, % | -4.01 | -4.97 | -5.27 | -5.69 | -4.73 | -4.93 | -4.93 | -4.93 | -4.93 | -4.93 |
| Tax Rate, % | 24.17 | 24.17 | 24.17 | 24.17 | 24.17 | 24.17 | 24.17 | 24.17 | 24.17 | 24.17 |
| EBITAT | 207.7 | 538.3 | 1,063.0 | 1,145.2 | 1,093.9 | 1,212.3 | 1,293.1 | 1,379.3 | 1,471.3 | 1,569.4 |
| Depreciation | ||||||||||
| Changes in Account Receivables | ||||||||||
| Changes in Inventories | ||||||||||
| Changes in Accounts Payable | ||||||||||
| Capital Expenditure | ||||||||||
| UFCF | -455.1 | 113.6 | 793.3 | 2,095.6 | 1,400.1 | 1,549.0 | 2,172.1 | 2,316.9 | 2,471.4 | 2,636.2 |
| WACC, % | 5.22 | 4.93 | 4.95 | 4.93 | 4.94 | 5 | 5 | 5 | 5 | 5 |
| PV UFCF | ||||||||||
| SUM PV UFCF | 9,546.8 | |||||||||
| Long Term Growth Rate, % | 4.00 | |||||||||
| Free cash flow (T + 1) | 2,742 | |||||||||
| Terminal Value | 275,454 | |||||||||
| Present Terminal Value | 215,874 | |||||||||
| Enterprise Value | 225,421 | |||||||||
| Net Debt | 2,687 | |||||||||
| Equity Value | 222,734 | |||||||||
| Diluted Shares Outstanding, MM | 54 | |||||||||
| Equity Value Per Share | 4,123.64 |
What You Will Receive
- Authentic GOCOLORSNS Financial Data: Pre-filled with Go Fashion's historical and projected figures for accurate analysis.
- Completely Customizable Template: Easily adjust key metrics such as revenue growth, WACC, and EBITDA %.
- Instant Calculations: Witness real-time updates of Go Fashion's intrinsic value as you make adjustments.
- Professional Valuation Instrument: Ideal for investors, analysts, and consultants in search of reliable DCF results.
- User-Friendly Layout: Straightforward design and clear guidance suitable for all experience levels.
Key Features
- 🔍 Real-Life GOCOLORSNS Financials: Pre-filled historical and projected data for Go Fashion (India) Limited.
- ✏️ Fully Customizable Inputs: Adjust all critical parameters (yellow cells) such as WACC, growth %, and tax rates.
- 📊 Professional DCF Valuation: Built-in formulas calculate Go Fashion's intrinsic value using the Discounted Cash Flow method.
- ⚡ Instant Results: Visualize Go Fashion's valuation immediately after making adjustments.
- Scenario Analysis: Test and compare outcomes for various financial assumptions side-by-side.
How It Works
- Step 1: Download the prebuilt Excel template featuring Go Fashion (India) Limited's [GOCOLORSNS] data.
- Step 2: Navigate through the pre-filled sheets to familiarize yourself with the essential metrics.
- Step 3: Adjust forecasts and assumptions in the editable yellow cells (WACC, growth, margins).
- Step 4: Instantly observe recalculated results, including Go Fashion's intrinsic value.
- Step 5: Make informed investment choices or create reports based on the outputs.
Why Choose This Calculator for Go Fashion (India) Limited (GOCOLORSNS)?
- User-Friendly Design: Tailored for both novices and seasoned users.
- Customizable Inputs: Effortlessly adjust parameters to fit your financial analysis.
- Real-Time Adjustments: Watch Go Fashion’s valuation change instantly as you modify data.
- Preloaded Data: Comes with Go Fashion’s current financial metrics for immediate insights.
- Relied Upon by Experts: Favored by investors and financial analysts for informed decision-making.
Who Can Benefit from This Product?
- Investors: Evaluate the valuation of Go Fashion (India) Limited (GOCOLORSNS) before making stock trades.
- CFOs and Financial Analysts: Enhance valuation workflows and assess financial projections.
- Startup Founders: Discover how leading public companies like Go Fashion (India) Limited are valued.
- Consultants: Provide detailed valuation reports for your clients based on GOCOLORSNS.
- Students and Educators: Utilize real-world examples to practice and teach valuation methods.
What the Template Includes
- Pre-Filled Data: Contains Go Fashion’s (GOCOLORSNS) historical financials and projections.
- Discounted Cash Flow Model: Editable DCF valuation model with automatic calculations.
- Weighted Average Cost of Capital (WACC): A dedicated worksheet for calculating WACC using customizable inputs.
- Key Financial Ratios: Evaluate Go Fashion’s profitability, efficiency, and financial leverage.
- Customizable Inputs: Easily modify revenue growth rates, profit margins, and tax rates.
- Clear Dashboard: Visual representations and tables summarizing essential valuation outcomes.
Disclaimer
All information, articles, and product details provided on this website are for general informational and educational purposes only. We do not claim any ownership over, nor do we intend to infringe upon, any trademarks, copyrights, logos, brand names, or other intellectual property mentioned or depicted on this site. Such intellectual property remains the property of its respective owners, and any references here are made solely for identification or informational purposes, without implying any affiliation, endorsement, or partnership.
We make no representations or warranties, express or implied, regarding the accuracy, completeness, or suitability of any content or products presented. Nothing on this website should be construed as legal, tax, investment, financial, medical, or other professional advice. In addition, no part of this site—including articles or product references—constitutes a solicitation, recommendation, endorsement, advertisement, or offer to buy or sell any securities, franchises, or other financial instruments, particularly in jurisdictions where such activity would be unlawful.
All content is of a general nature and may not address the specific circumstances of any individual or entity. It is not a substitute for professional advice or services. Any actions you take based on the information provided here are strictly at your own risk. You accept full responsibility for any decisions or outcomes arising from your use of this website and agree to release us from any liability in connection with your use of, or reliance upon, the content or products found herein.