
|
Godrej Properties Limited (Godrejprop.ns) تقييم DCF |
Fully Editable: Tailor To Your Needs In Excel Or Sheets
Professional Design: Trusted, Industry-Standard Templates
Investor-Approved Valuation Models
MAC/PC Compatible, Fully Unlocked
No Expertise Is Needed; Easy To Follow
Godrej Properties Limited (GODREJPROP.NS) Bundle
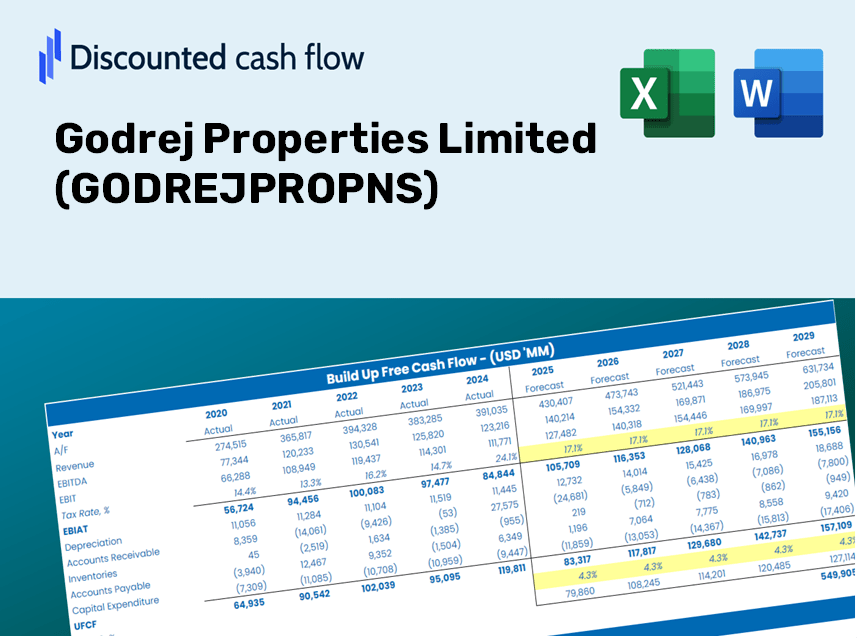
اكتساب نظرة ثاقبة على تحليل التقييم Godrej Properties Limited (GodrejPropns) مع حاسبة DCF الحديثة لدينا! يأتي قالب Excel هذا مسبقًا ببيانات (Godrejpropns) الحقيقية ، مما يتيح لك ضبط التوقعات والافتراضات لحساب القيمة الجوهرية لخصائص Godrej Limited بدقة.
Discounted Cash Flow (DCF) - (USD MM)
| Year | AY1 2021 |
AY2 2022 |
AY3 2023 |
AY4 2024 |
AY5 2025 |
FY1 2026 |
FY2 2027 |
FY3 2028 |
FY4 2029 |
FY5 2030 |
|---|---|---|---|---|---|---|---|---|---|---|
| Revenue | 7,649.2 | 18,248.8 | 22,522.6 | 30,356.2 | 49,228.4 | 76,349.5 | 118,412.4 | 183,648.7 | 284,825.3 | 441,742.5 |
| Revenue Growth, % | 0 | 138.57 | 23.42 | 34.78 | 62.17 | 55.09 | 55.09 | 55.09 | 55.09 | 55.09 |
| EBITDA | -3,370.3 | 1,245.6 | 2,459.8 | -998.0 | 526.7 | -4,356.7 | -6,756.9 | -10,479.5 | -16,252.9 | -25,207.1 |
| EBITDA, % | -44.06 | 6.83 | 10.92 | -3.29 | 1.07 | -5.71 | -5.71 | -5.71 | -5.71 | -5.71 |
| Depreciation | 158.7 | 128.3 | 156.9 | 344.4 | 615.2 | 894.6 | 1,387.5 | 2,151.9 | 3,337.4 | 5,176.0 |
| Depreciation, % | 2.07 | 0.70306 | 0.69663 | 1.13 | 1.25 | 1.17 | 1.17 | 1.17 | 1.17 | 1.17 |
| EBIT | -3,529.0 | 1,117.3 | 2,302.9 | -1,342.4 | -88.5 | -5,251.3 | -8,144.4 | -12,631.4 | -19,590.3 | -30,383.1 |
| EBIT, % | -46.14 | 6.12 | 10.22 | -4.42 | -0.17977 | -6.88 | -6.88 | -6.88 | -6.88 | -6.88 |
| Total Cash | 40,529.8 | 48,737.0 | 44,268.5 | 42,236.8 | 91,152.7 | 76,349.5 | 118,412.4 | 183,648.7 | 284,825.3 | 441,742.5 |
| Total Cash, percent | .0 | .0 | .0 | .0 | .0 | .0 | .0 | .0 | .0 | .0 |
| Account Receivables | 29,149.6 | 36,747.5 | 36,658.7 | 7,942.3 | 4,337.8 | 51,150.4 | 79,330.4 | 123,035.5 | 190,818.8 | 295,945.7 |
| Account Receivables, % | 381.08 | 201.37 | 162.76 | 26.16 | 8.81 | 67 | 67 | 67 | 67 | 67 |
| Inventories | 48,014.1 | 56,683.1 | 120,734.0 | 225,646.2 | 329,276.6 | 76,349.5 | 118,412.4 | 183,648.7 | 284,825.3 | 441,742.5 |
| Inventories, % | 627.7 | 310.61 | 536.06 | 743.33 | 668.88 | 100 | 100 | 100 | 100 | 100 |
| Accounts Payable | 19,017.0 | 22,541.0 | 29,598.3 | 37,555.7 | 35,230.9 | 72,007.7 | 111,678.6 | 173,205.0 | 268,628.0 | 416,621.7 |
| Accounts Payable, % | 248.61 | 123.52 | 131.42 | 123.72 | 71.57 | 94.31 | 94.31 | 94.31 | 94.31 | 94.31 |
| Capital Expenditure | -1,283.2 | -1,464.1 | -3,058.5 | -6,952.5 | -2,115.3 | -10,013.7 | -15,530.6 | -24,086.7 | -37,356.7 | -57,937.4 |
| Capital Expenditure, % | -16.78 | -8.02 | -13.58 | -22.9 | -4.3 | -13.12 | -13.12 | -13.12 | -13.12 | -13.12 |
| Tax Rate, % | 18.73 | 18.73 | 18.73 | 18.73 | 18.73 | 18.73 | 18.73 | 18.73 | 18.73 | 18.73 |
| EBITAT | -7,798.7 | 762.5 | 1,654.6 | -973.6 | -71.9 | -4,136.9 | -6,416.0 | -9,950.7 | -15,432.7 | -23,935.0 |
| Depreciation | ||||||||||
| Changes in Account Receivables | ||||||||||
| Changes in Inventories | ||||||||||
| Changes in Accounts Payable | ||||||||||
| Capital Expenditure | ||||||||||
| UFCF | -67,069.9 | -13,316.2 | -58,151.8 | -75,820.1 | -103,922.7 | 229,635.3 | -51,131.1 | -79,300.4 | -122,989.0 | -190,746.7 |
| WACC, % | 5.36 | 5.17 | 5.19 | 5.19 | 5.24 | 5.23 | 5.23 | 5.23 | 5.23 | 5.23 |
| PV UFCF | ||||||||||
| SUM PV UFCF | -144,145.4 | |||||||||
| Long Term Growth Rate, % | 2.00 | |||||||||
| Free cash flow (T + 1) | -194,562 | |||||||||
| Terminal Value | -6,024,836 | |||||||||
| Present Terminal Value | -4,669,402 | |||||||||
| Enterprise Value | -4,813,547 | |||||||||
| Net Debt | 72,556 | |||||||||
| Equity Value | -4,886,103 | |||||||||
| Diluted Shares Outstanding, MM | 286 | |||||||||
| Equity Value Per Share | -17,106.17 |
ما ستناله
- قالب Excel القابل للتخصيص: جهاز حاسبة DCF قائم على Excel مصمم خصيصًا لشركة Godrej Properties Limited، ويتميز بمقاييس مالية مملوءة مسبقًا.
- البيانات الشاملة: الوصول إلى الأداء التاريخي والإسقاطات المستقبلية (يبرز في الخلايا الصفراء).
- التنبؤ المرن: قم بتعديل الافتراضات الرئيسية مثل نمو الإيرادات وهامش الأرباح قبل الفوائد والضرائب والاستهلاك وإطفاء الدين و WACC حسب الحاجة.
- الحسابات الفورية: لاحظ بسرعة كيف تؤثر متغيرات الإدخال الخاصة بك على تقييم Godrej Properties Limited.
- الموارد المهنية: مصمم للمستثمرين والمديرين الماليين والاستشاريين والمحللين الماليين.
- تخطيط بديهي: تم تنظيمه من أجل البساطة وسهولة الاستخدام، مع إرشادات خطوة بخطوة.
الميزات الرئيسية
- البيانات التي تم تحميلها مسبقًا: بيانات Godrej Properties Limited التاريخية والتوقعات المليئة مسبقًا.
- مدخلات قابلة للتعديل بالكامل: تخصيص WACC ، ومعدلات الضرائب ، ونمو الإيرادات ، وهامش الأرباح قبل الفوائد والضرائب والإهلاك والاستهلاك.
- النتائج الفورية: شاهد القيمة الجوهرية لـ Godrej Properties Limited في الوقت الفعلي.
- واضحة المخرجات المرئية: تعرض مخططات لوحة القيادة نتائج التقييم والمقاييس الأساسية.
- بنيت للدقة: أداة احترافية مصممة للمحللين والمستثمرين ومتخصصين التمويل.
كيف تعمل
- قم بتنزيل القالب: الحصول على وصول فوري إلى حاسبة Godrejpropns DCF المستندة إلى Excel.
- أدخل افتراضاتك: تعديل الخلايا ذات الضوء الصفراء لمعدلات النمو ، WACC ، الهوامش ، والمعلمات الإضافية.
- الحسابات الفورية: يقوم النموذج تلقائيًا بإعادة حساب القيمة الجوهرية لـ Godrej Properties Limited.
- سيناريوهات الاختبار: تجربة الافتراضات المختلفة لتقييم التغييرات المحتملة في التقييم.
- تحليل وتحديد: الاستفادة من النتائج لإبلاغ التقييمات المالية أو التقييمات المالية.
لماذا تختار هذه الآلة الحاسبة لـ Godrej Properties Limited (Godrejpropns)؟
- مصمم خصيصًا لخبراء الصناعة: أداة متطورة تستخدمها محللي العقارات والموظفين الماليين والمستشارين.
- بيانات شاملة: يتم تحميل البيانات المالية التاريخية والمتوقعة لـ Godrej Properties من أجل الدقة المعززة.
- تحليل السيناريو: محاكاة مختلف التوقعات والافتراضات.
- مخرجات شاملة: يحسب تلقائيًا القيمة الجوهرية ، NPV ، والمقاييس الأساسية الأخرى.
- واجهة سهلة الاستخدام: إرشادات خطوة بخطوة تبسيط العملية بأكملها.
من يمكنه الاستفادة من Godrej Properties Limited (Godrejpropns)؟
- المستثمرون العقاريون: اتخاذ خيارات مستنيرة مع أدوات تقييم الممتلكات المتقدمة لدينا.
- محللي السوق: قم بتبسيط عملية التحليل الخاصة بك مع نماذجنا المالية الجاهزة للاستخدام.
- الاستشاريون: بسهولة تخصيص قوالبنا لعروض العميل أو تقارير المشروع.
- عشاق الممتلكات: عزز معرفتك بالتقييم العقاري من خلال أمثلة عملية.
- المعلمون والطلاب: الاستفادة من هذا المورد كمساعدات تعليمية فعالة في دورات العقارات والتمويل.
محتويات القالب
- البيانات التاريخية: يتضمن الأداء المالي السابق لـ Godrej Properties Limited والتنبؤات التأسيسية.
- نماذج DCF و Ruvered DCF: قوالب شاملة مصممة لتحديد القيمة الجوهرية لخصائص Godrej Limited.
- ورقة WACC: حسابات مصممة مسبقًا لمتوسط تكلفة رأس المال المرجح.
- مدخلات قابلة للتحرير: اضبط المتغيرات الرئيسية مثل معدلات النمو ونسب EBITDA وافتراضات Capex.
- البيانات الفصلية والسنوية: تحليل شامل لتقارير Godrej Properties Limited.
- لوحة القيادة التفاعلية: تصور ديناميكيا نتائج التقييم والتوقعات.
Disclaimer
All information, articles, and product details provided on this website are for general informational and educational purposes only. We do not claim any ownership over, nor do we intend to infringe upon, any trademarks, copyrights, logos, brand names, or other intellectual property mentioned or depicted on this site. Such intellectual property remains the property of its respective owners, and any references here are made solely for identification or informational purposes, without implying any affiliation, endorsement, or partnership.
We make no representations or warranties, express or implied, regarding the accuracy, completeness, or suitability of any content or products presented. Nothing on this website should be construed as legal, tax, investment, financial, medical, or other professional advice. In addition, no part of this site—including articles or product references—constitutes a solicitation, recommendation, endorsement, advertisement, or offer to buy or sell any securities, franchises, or other financial instruments, particularly in jurisdictions where such activity would be unlawful.
All content is of a general nature and may not address the specific circumstances of any individual or entity. It is not a substitute for professional advice or services. Any actions you take based on the information provided here are strictly at your own risk. You accept full responsibility for any decisions or outcomes arising from your use of this website and agree to release us from any liability in connection with your use of, or reliance upon, the content or products found herein.