
|
Godrej Properties Limited (Godrejprop.NS) Évaluation DCF |
Entièrement Modifiable: Adapté À Vos Besoins Dans Excel Ou Sheets
Conception Professionnelle: Modèles Fiables Et Conformes Aux Normes Du Secteur
Pré-Construits Pour Une Utilisation Rapide Et Efficace
Compatible MAC/PC, entièrement débloqué
Aucune Expertise N'Est Requise; Facile À Suivre
Godrej Properties Limited (GODREJPROP.NS) Bundle
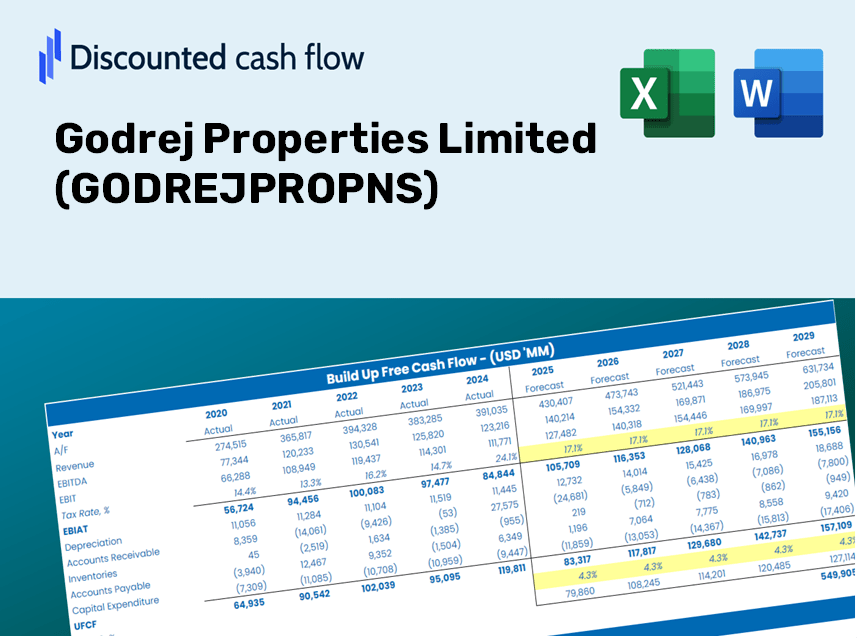
Gardez un aperçu de votre analyse d'évaluation de vos propriétés Godrej Limited (Godrejpropns) avec notre calculatrice DCF de pointe! Ce modèle Excel est préchargé avec des données réelles (Godrejpropns), vous permettant d'ajuster les prévisions et les hypothèses pour calculer avec précision la valeur intrinsèque de Godrej Properties Limited.
Discounted Cash Flow (DCF) - (USD MM)
| Year | AY1 2021 |
AY2 2022 |
AY3 2023 |
AY4 2024 |
AY5 2025 |
FY1 2026 |
FY2 2027 |
FY3 2028 |
FY4 2029 |
FY5 2030 |
|---|---|---|---|---|---|---|---|---|---|---|
| Revenue | 7,649.2 | 18,248.8 | 22,522.6 | 30,356.2 | 49,228.4 | 76,349.5 | 118,412.4 | 183,648.7 | 284,825.3 | 441,742.5 |
| Revenue Growth, % | 0 | 138.57 | 23.42 | 34.78 | 62.17 | 55.09 | 55.09 | 55.09 | 55.09 | 55.09 |
| EBITDA | -3,370.3 | 1,245.6 | 2,459.8 | -998.0 | 526.7 | -4,356.7 | -6,756.9 | -10,479.5 | -16,252.9 | -25,207.1 |
| EBITDA, % | -44.06 | 6.83 | 10.92 | -3.29 | 1.07 | -5.71 | -5.71 | -5.71 | -5.71 | -5.71 |
| Depreciation | 158.7 | 128.3 | 156.9 | 344.4 | 615.2 | 894.6 | 1,387.5 | 2,151.9 | 3,337.4 | 5,176.0 |
| Depreciation, % | 2.07 | 0.70306 | 0.69663 | 1.13 | 1.25 | 1.17 | 1.17 | 1.17 | 1.17 | 1.17 |
| EBIT | -3,529.0 | 1,117.3 | 2,302.9 | -1,342.4 | -88.5 | -5,251.3 | -8,144.4 | -12,631.4 | -19,590.3 | -30,383.1 |
| EBIT, % | -46.14 | 6.12 | 10.22 | -4.42 | -0.17977 | -6.88 | -6.88 | -6.88 | -6.88 | -6.88 |
| Total Cash | 40,529.8 | 48,737.0 | 44,268.5 | 42,236.8 | 91,152.7 | 76,349.5 | 118,412.4 | 183,648.7 | 284,825.3 | 441,742.5 |
| Total Cash, percent | .0 | .0 | .0 | .0 | .0 | .0 | .0 | .0 | .0 | .0 |
| Account Receivables | 29,149.6 | 36,747.5 | 36,658.7 | 7,942.3 | 4,337.8 | 51,150.4 | 79,330.4 | 123,035.5 | 190,818.8 | 295,945.7 |
| Account Receivables, % | 381.08 | 201.37 | 162.76 | 26.16 | 8.81 | 67 | 67 | 67 | 67 | 67 |
| Inventories | 48,014.1 | 56,683.1 | 120,734.0 | 225,646.2 | 329,276.6 | 76,349.5 | 118,412.4 | 183,648.7 | 284,825.3 | 441,742.5 |
| Inventories, % | 627.7 | 310.61 | 536.06 | 743.33 | 668.88 | 100 | 100 | 100 | 100 | 100 |
| Accounts Payable | 19,017.0 | 22,541.0 | 29,598.3 | 37,555.7 | 35,230.9 | 72,007.7 | 111,678.6 | 173,205.0 | 268,628.0 | 416,621.7 |
| Accounts Payable, % | 248.61 | 123.52 | 131.42 | 123.72 | 71.57 | 94.31 | 94.31 | 94.31 | 94.31 | 94.31 |
| Capital Expenditure | -1,283.2 | -1,464.1 | -3,058.5 | -6,952.5 | -2,115.3 | -10,013.7 | -15,530.6 | -24,086.7 | -37,356.7 | -57,937.4 |
| Capital Expenditure, % | -16.78 | -8.02 | -13.58 | -22.9 | -4.3 | -13.12 | -13.12 | -13.12 | -13.12 | -13.12 |
| Tax Rate, % | 18.73 | 18.73 | 18.73 | 18.73 | 18.73 | 18.73 | 18.73 | 18.73 | 18.73 | 18.73 |
| EBITAT | -7,798.7 | 762.5 | 1,654.6 | -973.6 | -71.9 | -4,136.9 | -6,416.0 | -9,950.7 | -15,432.7 | -23,935.0 |
| Depreciation | ||||||||||
| Changes in Account Receivables | ||||||||||
| Changes in Inventories | ||||||||||
| Changes in Accounts Payable | ||||||||||
| Capital Expenditure | ||||||||||
| UFCF | -67,069.9 | -13,316.2 | -58,151.8 | -75,820.1 | -103,922.7 | 229,635.3 | -51,131.1 | -79,300.4 | -122,989.0 | -190,746.7 |
| WACC, % | 5.36 | 5.17 | 5.19 | 5.19 | 5.24 | 5.23 | 5.23 | 5.23 | 5.23 | 5.23 |
| PV UFCF | ||||||||||
| SUM PV UFCF | -144,145.4 | |||||||||
| Long Term Growth Rate, % | 2.00 | |||||||||
| Free cash flow (T + 1) | -194,562 | |||||||||
| Terminal Value | -6,024,836 | |||||||||
| Present Terminal Value | -4,669,402 | |||||||||
| Enterprise Value | -4,813,547 | |||||||||
| Net Debt | 72,556 | |||||||||
| Equity Value | -4,886,103 | |||||||||
| Diluted Shares Outstanding, MM | 286 | |||||||||
| Equity Value Per Share | -17,106.17 |
What You Will Receive
- Customizable Excel Template: An Excel-based DCF Calculator tailored for Godrej Properties Limited, featuring pre-filled financial metrics.
- Comprehensive Data: Access to historical performance and future projections (highlighted in the yellow cells).
- Flexible Forecasting: Adjust key assumptions such as revenue growth, EBITDA margin, and WACC as needed.
- Instant Calculations: Quickly observe how your input variables affect the valuation of Godrej Properties Limited.
- Professional Resource: Designed for investors, CFOs, consultants, and financial analysts.
- Intuitive Layout: Organized for simplicity and user-friendliness, complete with step-by-step guidance.
Key Features
- Pre-Loaded Data: Godrej Properties Limited’s historical financial statements and pre-filled projections.
- Fully Adjustable Inputs: Customize WACC, tax rates, revenue growth, and EBITDA margins.
- Instant Results: Watch Godrej Properties Limited’s intrinsic value recalculate in real time.
- Clear Visual Outputs: Dashboard charts showcase valuation results and essential metrics.
- Built for Accuracy: A professional tool designed for analysts, investors, and finance specialists.
How It Functions
- Download the Template: Gain immediate access to the Excel-based GODREJPROPNS DCF Calculator.
- Input Your Assumptions: Modify the yellow-highlighted cells for growth rates, WACC, margins, and additional parameters.
- Instant Calculations: The model automatically recalculates Godrej Properties Limited’s intrinsic value.
- Test Scenarios: Experiment with various assumptions to assess potential changes in valuation.
- Analyze and Decide: Utilize the outcomes to inform your investment or financial evaluations.
Why Choose This Calculator for Godrej Properties Limited (GODREJPROPNS)?
- Tailored for Industry Experts: A sophisticated tool utilized by real estate analysts, financial officers, and consultants.
- Comprehensive Data: Godrej Properties’ historical and forecasted financials are preloaded for enhanced precision.
- Scenario Analysis: Effortlessly simulate various forecasts and assumptions.
- Comprehensive Outputs: Automatically calculates intrinsic value, NPV, and other essential metrics.
- User-Friendly Interface: Step-by-step guidance simplifies the entire process.
Who Can Benefit from Godrej Properties Limited (GODREJPROPNS)?
- Real Estate Investors: Make informed choices with our advanced property valuation tools.
- Market Analysts: Streamline your analysis process with our ready-to-use financial models.
- Consultants: Easily tailor our templates for client presentations or project reports.
- Property Enthusiasts: Enhance your knowledge of real estate valuation through practical examples.
- Teachers and Students: Utilize this resource as an effective learning aid in real estate and finance courses.
Contents of the Template
- Historical Data: Incorporates Godrej Properties Limited’s past financial performance and foundational forecasts.
- DCF and Levered DCF Models: Comprehensive templates designed to determine the intrinsic value of Godrej Properties Limited.
- WACC Sheet: Pre-built calculations for the Weighted Average Cost of Capital.
- Editable Inputs: Adjust key variables such as growth rates, EBITDA percentages, and CAPEX assumptions.
- Quarterly and Annual Statements: A thorough analysis of Godrej Properties Limited’s financial reports.
- Interactive Dashboard: Dynamically visualize valuation outcomes and forecasts.
Disclaimer
All information, articles, and product details provided on this website are for general informational and educational purposes only. We do not claim any ownership over, nor do we intend to infringe upon, any trademarks, copyrights, logos, brand names, or other intellectual property mentioned or depicted on this site. Such intellectual property remains the property of its respective owners, and any references here are made solely for identification or informational purposes, without implying any affiliation, endorsement, or partnership.
We make no representations or warranties, express or implied, regarding the accuracy, completeness, or suitability of any content or products presented. Nothing on this website should be construed as legal, tax, investment, financial, medical, or other professional advice. In addition, no part of this site—including articles or product references—constitutes a solicitation, recommendation, endorsement, advertisement, or offer to buy or sell any securities, franchises, or other financial instruments, particularly in jurisdictions where such activity would be unlawful.
All content is of a general nature and may not address the specific circumstances of any individual or entity. It is not a substitute for professional advice or services. Any actions you take based on the information provided here are strictly at your own risk. You accept full responsibility for any decisions or outcomes arising from your use of this website and agree to release us from any liability in connection with your use of, or reliance upon, the content or products found herein.