
|
Humana Inc. (HUM) تقييم DCF |
Fully Editable: Tailor To Your Needs In Excel Or Sheets
Professional Design: Trusted, Industry-Standard Templates
Investor-Approved Valuation Models
MAC/PC Compatible, Fully Unlocked
No Expertise Is Needed; Easy To Follow
Humana Inc. (HUM) Bundle
تبسيط التقييم Humana Inc. (HUM) مع هذه الآلة الحاسبة DCF القابلة للتخصيص! تتميز REAL Humana Inc. (HUM) ومدخلات التنبؤ القابلة للتعديل ، يمكنك اختبار السيناريوهات وكشف القيمة العادلة لـ Humana Inc. (HUM) في دقائق.
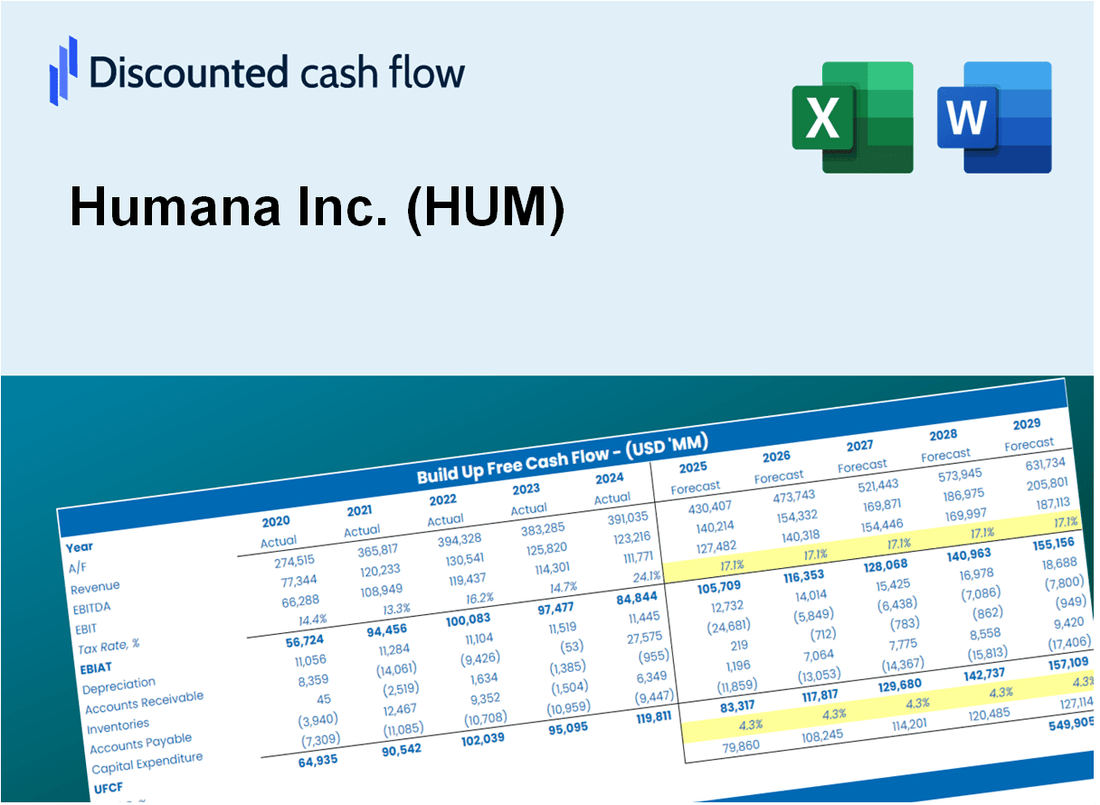
Discounted Cash Flow (DCF) - (USD MM)
| Year | AY1 2020 |
AY2 2021 |
AY3 2022 |
AY4 2023 |
AY5 2024 |
FY1 2025 |
FY2 2026 |
FY3 2027 |
FY4 2028 |
FY5 2029 |
|---|---|---|---|---|---|---|---|---|---|---|
| Revenue | 77,155.0 | 83,064.0 | 92,870.0 | 106,374.0 | 117,761.0 | 130,923.6 | 145,557.3 | 161,826.8 | 179,914.8 | 200,024.5 |
| Revenue Growth, % | 0 | 7.66 | 11.81 | 14.54 | 10.7 | 11.18 | 11.18 | 11.18 | 11.18 | 11.18 |
| EBITDA | 5,499.0 | 4,393.0 | 4,814.0 | 4,793.0 | 3,349.0 | 6,532.9 | 7,263.1 | 8,074.9 | 8,977.5 | 9,980.9 |
| EBITDA, % | 7.13 | 5.29 | 5.18 | 4.51 | 2.84 | 4.99 | 4.99 | 4.99 | 4.99 | 4.99 |
| Depreciation | 616.0 | 713.0 | 845.0 | 917.0 | 968.0 | 1,113.0 | 1,237.4 | 1,375.8 | 1,529.5 | 1,700.5 |
| Depreciation, % | 0.79839 | 0.85837 | 0.90987 | 0.86205 | 0.822 | 0.85014 | 0.85014 | 0.85014 | 0.85014 | 0.85014 |
| EBIT | 4,883.0 | 3,680.0 | 3,969.0 | 3,876.0 | 2,381.0 | 5,419.8 | 6,025.6 | 6,699.1 | 7,447.9 | 8,280.4 |
| EBIT, % | 6.33 | 4.43 | 4.27 | 3.64 | 2.02 | 4.14 | 4.14 | 4.14 | 4.14 | 4.14 |
| Total Cash | 4,673.0 | 3,394.0 | 5,061.0 | 21,320.0 | 20,435.0 | 13,874.7 | 15,425.5 | 17,149.6 | 19,066.5 | 21,197.6 |
| Total Cash, percent | .0 | .0 | .0 | .0 | .0 | .0 | .0 | .0 | .0 | .0 |
| Account Receivables | 1,138.0 | 1,814.0 | 1,674.0 | 2,035.0 | 2,704.0 | 2,532.2 | 2,815.2 | 3,129.9 | 3,479.8 | 3,868.7 |
| Account Receivables, % | 1.47 | 2.18 | 1.8 | 1.91 | 2.3 | 1.93 | 1.93 | 1.93 | 1.93 | 1.93 |
| Inventories | .0 | .0 | .0 | .0 | .0 | .0 | .0 | .0 | .0 | .0 |
| Inventories, % | 0 | 0 | 0 | 0 | 0 | 0 | 0 | 0 | 0 | 0 |
| Accounts Payable | 3,693.0 | 4,183.0 | 4,940.0 | 16,810.0 | 15,699.0 | 11,593.4 | 12,889.3 | 14,330.0 | 15,931.7 | 17,712.4 |
| Accounts Payable, % | 4.79 | 5.04 | 5.32 | 15.8 | 13.33 | 8.86 | 8.86 | 8.86 | 8.86 | 8.86 |
| Capital Expenditure | -964.0 | -1,316.0 | -1,120.0 | -1,004.0 | -575.0 | -1,432.8 | -1,592.9 | -1,771.0 | -1,968.9 | -2,189.0 |
| Capital Expenditure, % | -1.25 | -1.58 | -1.21 | -0.94384 | -0.48828 | -1.09 | -1.09 | -1.09 | -1.09 | -1.09 |
| Tax Rate, % | 29.87 | 29.87 | 29.87 | 29.87 | 29.87 | 29.87 | 29.87 | 29.87 | 29.87 | 29.87 |
| EBITAT | 3,574.1 | 3,218.1 | 3,121.4 | 2,851.7 | 1,669.9 | 4,151.5 | 4,615.6 | 5,131.5 | 5,705.0 | 6,342.7 |
| Depreciation | ||||||||||
| Changes in Account Receivables | ||||||||||
| Changes in Inventories | ||||||||||
| Changes in Accounts Payable | ||||||||||
| Capital Expenditure | ||||||||||
| UFCF | 5,781.1 | 2,429.1 | 3,743.4 | 14,273.7 | 282.9 | -102.0 | 5,272.9 | 5,862.2 | 6,517.5 | 7,246.0 |
| WACC, % | 5.3 | 5.51 | 5.38 | 5.31 | 5.26 | 5.35 | 5.35 | 5.35 | 5.35 | 5.35 |
| PV UFCF | ||||||||||
| SUM PV UFCF | 20,540.2 | |||||||||
| Long Term Growth Rate, % | 2.00 | |||||||||
| Free cash flow (T + 1) | 7,391 | |||||||||
| Terminal Value | 220,399 | |||||||||
| Present Terminal Value | 169,812 | |||||||||
| Enterprise Value | 190,352 | |||||||||
| Net Debt | 9,500 | |||||||||
| Equity Value | 180,852 | |||||||||
| Diluted Shares Outstanding, MM | 121 | |||||||||
| Equity Value Per Share | 1,496.26 |
What You Will Get
- Real Humana Data: Preloaded financials – from revenue to EBIT – based on actual and projected figures.
- Full Customization: Adjust all critical parameters (yellow cells) like WACC, growth %, and tax rates.
- Instant Valuation Updates: Automatic recalculations to analyze the impact of changes on Humana’s fair value.
- Versatile Excel Template: Tailored for quick edits, scenario testing, and detailed projections.
- Time-Saving and Accurate: Skip building models from scratch while maintaining precision and flexibility.
Key Features
- Comprehensive DCF Calculator: Provides in-depth unlevered and levered DCF valuation models tailored for Humana Inc. (HUM).
- WACC Calculator: Features a pre-configured Weighted Average Cost of Capital sheet with adjustable inputs specific to healthcare.
- Customizable Forecast Assumptions: Easily adjust growth rates, capital expenditures, and discount rates to reflect market conditions.
- Integrated Financial Ratios: Evaluate profitability, leverage, and efficiency ratios specifically for Humana Inc. (HUM).
- Interactive Dashboard and Charts: Visual representations of key valuation metrics facilitate straightforward analysis.
How It Works
- Download the Template: Get instant access to the Excel-based HUM DCF Calculator.
- Input Your Assumptions: Adjust yellow-highlighted cells for growth rates, WACC, margins, and more.
- Instant Calculations: The model automatically updates Humana Inc.’s intrinsic value.
- Test Scenarios: Simulate different assumptions to evaluate potential valuation changes.
- Analyze and Decide: Use the results to guide your investment or financial analysis.
Why Choose This Calculator for Humana Inc. (HUM)?
- Accurate Data: Real Humana financials provide trustworthy valuation outcomes.
- Customizable: Modify essential parameters such as growth rates, WACC, and tax rates to align with your forecasts.
- Time-Saving: Pre-built calculations streamline the process and eliminate the need for starting from scratch.
- Professional-Grade Tool: Tailored for investors, analysts, and consultants in the healthcare sector.
- User-Friendly: An intuitive design and step-by-step guidance ensure ease of use for everyone.
Who Should Use This Product?
- Investors: Accurately assess Humana Inc.’s (HUM) fair value prior to making investment choices.
- CFOs: Utilize a high-quality DCF model for financial reporting and analysis at Humana Inc. (HUM).
- Consultants: Easily customize the template for valuation reports tailored for Humana Inc. (HUM) clients.
- Entrepreneurs: Discover financial modeling techniques employed by leading healthcare companies like Humana Inc. (HUM).
- Educators: Implement it as a teaching resource to illustrate valuation methodologies relevant to Humana Inc. (HUM).
What the Template Contains
- Pre-Filled DCF Model: Humana Inc.’s (HUM) financial data preloaded for immediate use.
- WACC Calculator: Detailed calculations for Weighted Average Cost of Capital.
- Financial Ratios: Evaluate Humana Inc.’s (HUM) profitability, leverage, and efficiency.
- Editable Inputs: Change assumptions such as growth, margins, and CAPEX to fit your scenarios.
- Financial Statements: Annual and quarterly reports to support detailed analysis.
- Interactive Dashboard: Easily visualize key valuation metrics and results.
Disclaimer
All information, articles, and product details provided on this website are for general informational and educational purposes only. We do not claim any ownership over, nor do we intend to infringe upon, any trademarks, copyrights, logos, brand names, or other intellectual property mentioned or depicted on this site. Such intellectual property remains the property of its respective owners, and any references here are made solely for identification or informational purposes, without implying any affiliation, endorsement, or partnership.
We make no representations or warranties, express or implied, regarding the accuracy, completeness, or suitability of any content or products presented. Nothing on this website should be construed as legal, tax, investment, financial, medical, or other professional advice. In addition, no part of this site—including articles or product references—constitutes a solicitation, recommendation, endorsement, advertisement, or offer to buy or sell any securities, franchises, or other financial instruments, particularly in jurisdictions where such activity would be unlawful.
All content is of a general nature and may not address the specific circumstances of any individual or entity. It is not a substitute for professional advice or services. Any actions you take based on the information provided here are strictly at your own risk. You accept full responsibility for any decisions or outcomes arising from your use of this website and agree to release us from any liability in connection with your use of, or reliance upon, the content or products found herein.