
|
شركة لينكولن الوطنية (LNC) تقييم DCF |
Fully Editable: Tailor To Your Needs In Excel Or Sheets
Professional Design: Trusted, Industry-Standard Templates
Investor-Approved Valuation Models
MAC/PC Compatible, Fully Unlocked
No Expertise Is Needed; Easy To Follow
Lincoln National Corporation (LNC) Bundle
استكشف المستقبل المالي لشركة Lincoln National Corporation (LNC) مع حاسبة DCF سهلة الاستخدام! أدخل توقعاتك على النمو والهوامش والمصروفات لتحديد القيمة الجوهرية لشركة لينكولن الوطنية (LNC) وتعزيز استراتيجية الاستثمار الخاصة بك.
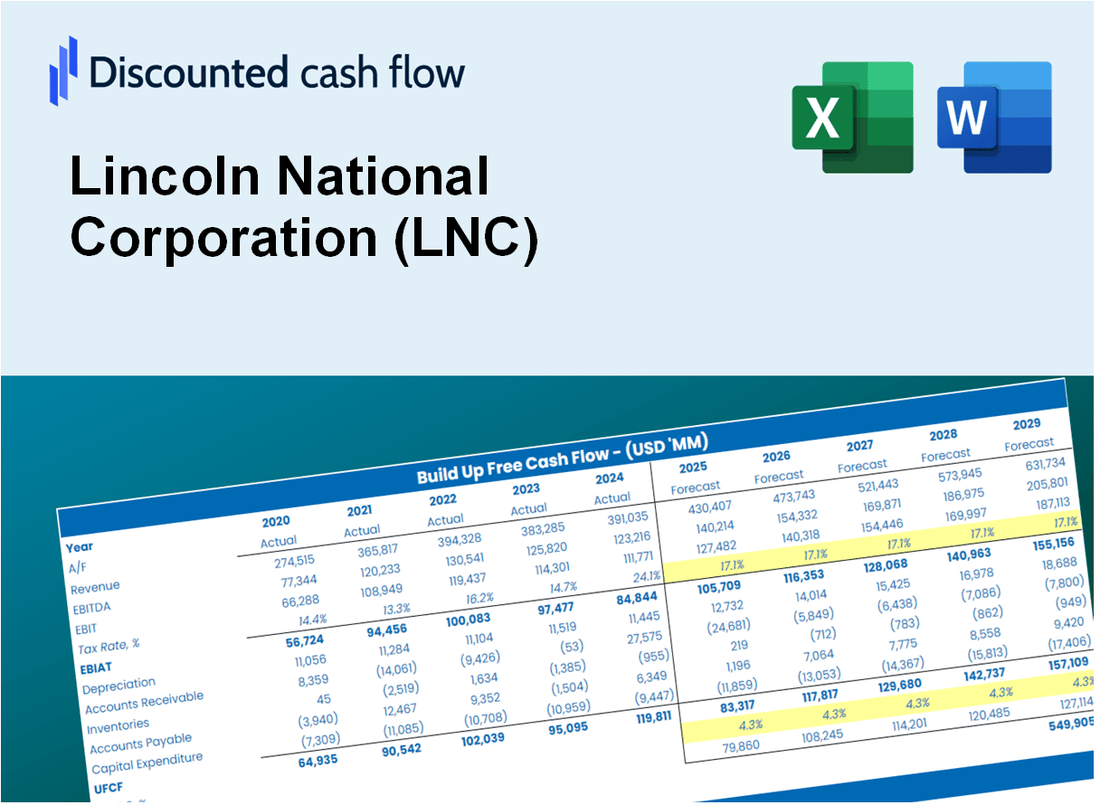
Discounted Cash Flow (DCF) - (USD MM)
| Year | AY1 2020 |
AY2 2021 |
AY3 2022 |
AY4 2023 |
AY5 2024 |
FY1 2025 |
FY2 2026 |
FY3 2027 |
FY4 2028 |
FY5 2029 |
|---|---|---|---|---|---|---|---|---|---|---|
| Revenue | 17,579.0 | 17,605.0 | 18,929.0 | 11,711.0 | 17,989.0 | 19,029.9 | 20,130.9 | 21,295.7 | 22,527.9 | 23,831.4 |
| Revenue Growth, % | 0 | 0.1479 | 7.52 | -38.13 | 53.61 | 5.79 | 5.79 | 5.79 | 5.79 | 5.79 |
| EBITDA | 744.0 | 4,963.0 | 2,073.0 | -773.0 | 4,454.0 | 2,341.9 | 2,477.5 | 2,620.8 | 2,772.4 | 2,932.9 |
| EBITDA, % | 4.23 | 28.19 | 10.95 | -6.6 | 24.76 | 12.31 | 12.31 | 12.31 | 12.31 | 12.31 |
| Depreciation | 37.0 | 50.0 | 65.0 | 44.0 | 96.0 | 66.5 | 70.3 | 74.4 | 78.7 | 83.3 |
| Depreciation, % | 0.21048 | 0.28401 | 0.34339 | 0.37572 | 0.53366 | 0.34945 | 0.34945 | 0.34945 | 0.34945 | 0.34945 |
| EBIT | 707.0 | 4,913.0 | 2,008.0 | -817.0 | 4,358.0 | 2,275.4 | 2,407.1 | 2,546.4 | 2,693.7 | 2,849.6 |
| EBIT, % | 4.02 | 27.91 | 10.61 | -6.98 | 24.23 | 11.96 | 11.96 | 11.96 | 11.96 | 11.96 |
| Total Cash | 124,752.0 | 121,358.0 | 103,079.0 | 92,103.0 | 26,717.0 | 19,029.9 | 20,130.9 | 21,295.7 | 22,527.9 | 23,831.4 |
| Total Cash, percent | .0 | .0 | .0 | .0 | .0 | .0 | .0 | .0 | .0 | .0 |
| Account Receivables | 16,982.0 | 20,295.0 | 19,953.0 | 29,843.0 | 28,750.0 | 18,900.6 | 19,994.2 | 21,151.1 | 22,374.9 | 23,669.5 |
| Account Receivables, % | 96.6 | 115.28 | 105.41 | 254.83 | 159.82 | 99.32 | 99.32 | 99.32 | 99.32 | 99.32 |
| Inventories | .0 | -7,413.0 | -7,509.0 | -52,833.0 | .0 | -6,918.4 | -7,318.7 | -7,742.1 | -8,190.1 | -8,664.0 |
| Inventories, % | 0 | -42.11 | -39.67 | -451.14 | 0 | -36.36 | -36.36 | -36.36 | -36.36 | -36.36 |
| Accounts Payable | .0 | .0 | .0 | .0 | .0 | .0 | .0 | .0 | .0 | .0 |
| Accounts Payable, % | 0 | 0 | 0 | 0 | 0 | 0 | 0 | 0 | 0 | 0 |
| Capital Expenditure | .0 | .0 | .0 | .0 | .0 | .0 | .0 | .0 | .0 | .0 |
| Capital Expenditure, % | 0 | 0 | 0 | 0 | 0 | 0 | 0 | 0 | 0 | 0 |
| Tax Rate, % | 18.57 | 18.57 | 18.57 | 18.57 | 18.57 | 18.57 | 18.57 | 18.57 | 18.57 | 18.57 |
| EBITAT | 834.0 | 3,997.7 | 1,580.8 | -535.2 | 3,548.6 | 1,852.3 | 1,959.5 | 2,072.9 | 2,192.8 | 2,319.7 |
| Depreciation | ||||||||||
| Changes in Account Receivables | ||||||||||
| Changes in Inventories | ||||||||||
| Changes in Accounts Payable | ||||||||||
| Capital Expenditure | ||||||||||
| UFCF | -16,111.0 | 8,147.7 | 2,083.8 | 34,942.8 | -48,095.4 | 18,686.6 | 1,336.6 | 1,413.9 | 1,495.7 | 1,582.2 |
| WACC, % | 7.8 | 7.34 | 7.27 | 6.94 | 7.34 | 7.34 | 7.34 | 7.34 | 7.34 | 7.34 |
| PV UFCF | ||||||||||
| SUM PV UFCF | 21,948.9 | |||||||||
| Long Term Growth Rate, % | 2.00 | |||||||||
| Free cash flow (T + 1) | 1,614 | |||||||||
| Terminal Value | 30,220 | |||||||||
| Present Terminal Value | 21,207 | |||||||||
| Enterprise Value | 43,156 | |||||||||
| Net Debt | 554 | |||||||||
| Equity Value | 42,602 | |||||||||
| Diluted Shares Outstanding, MM | 174 | |||||||||
| Equity Value Per Share | 245.12 |
What You Will Receive
- Comprehensive Financial Model: Lincoln National Corporation’s actual data facilitates accurate DCF valuation.
- Complete Forecast Flexibility: Modify revenue growth, profit margins, WACC, and other essential metrics.
- Real-Time Calculations: Automatic updates provide immediate feedback as you adjust inputs.
- Professional-Grade Template: A polished Excel file crafted for high-quality valuation processes.
- Adaptable and Reusable: Designed for versatility, allowing for repeated application in detailed forecasting.
Key Features
- Comprehensive LNC Data: Pre-filled with Lincoln National Corporation’s historical financials and future projections.
- Fully Customizable Inputs: Modify revenue growth rates, profit margins, WACC, tax rates, and capital expenditures.
- Dynamic Valuation Model: Automatic recalculations of Net Present Value (NPV) and intrinsic value based on your adjustments.
- Scenario Testing: Develop various forecasting scenarios to evaluate different valuation results.
- User-Friendly Design: Intuitive, organized, and suitable for both professionals and novices.
How It Works
- 1. Access the Template: Download and open the Excel file featuring Lincoln National Corporation’s (LNC) preloaded data.
- 2. Modify Inputs: Adjust critical parameters such as growth rates, WACC, and capital expenditures.
- 3. View Results in Real-Time: The DCF model automatically computes intrinsic value and NPV.
- 4. Explore Different Scenarios: Evaluate various forecasts to assess diverse valuation results.
- 5. Present with Assurance: Deliver professional valuation insights to enhance your decision-making process.
Why Choose This Calculator for Lincoln National Corporation (LNC)?
- Accuracy: Utilizes real Lincoln National Corporation financials to ensure precise data.
- Flexibility: Allows users to experiment with and adjust inputs effortlessly.
- Time-Saving: Avoid the complexity of constructing a DCF model from the ground up.
- Professional-Grade: Crafted with the precision and usability expected at the CFO level.
- User-Friendly: Intuitive design makes it accessible for users without extensive financial modeling skills.
Who Should Use Lincoln National Corporation (LNC)?
- Insurance Professionals: Develop comprehensive risk assessment models for policy evaluation.
- Financial Analysts: Conduct in-depth analyses to inform investment strategies related to Lincoln National Corporation (LNC).
- Retirement Planners: Offer clients informed insights on annuities and life insurance products from Lincoln National Corporation (LNC).
- Students and Educators: Utilize practical case studies to enhance learning in finance and insurance courses.
- Market Researchers: Investigate the performance and market position of Lincoln National Corporation (LNC) within the insurance industry.
What the Template Contains
- Preloaded LNC Data: Historical and projected financial data, including revenue, EBIT, and capital expenditures.
- DCF and WACC Models: Professional-grade sheets for calculating intrinsic value and Weighted Average Cost of Capital.
- Editable Inputs: Yellow-highlighted cells for adjusting revenue growth, tax rates, and discount rates.
- Financial Statements: Comprehensive annual and quarterly financials for deeper analysis.
- Key Ratios: Profitability, leverage, and efficiency ratios to evaluate performance.
- Dashboard and Charts: Visual summaries of valuation outcomes and assumptions.
Disclaimer
All information, articles, and product details provided on this website are for general informational and educational purposes only. We do not claim any ownership over, nor do we intend to infringe upon, any trademarks, copyrights, logos, brand names, or other intellectual property mentioned or depicted on this site. Such intellectual property remains the property of its respective owners, and any references here are made solely for identification or informational purposes, without implying any affiliation, endorsement, or partnership.
We make no representations or warranties, express or implied, regarding the accuracy, completeness, or suitability of any content or products presented. Nothing on this website should be construed as legal, tax, investment, financial, medical, or other professional advice. In addition, no part of this site—including articles or product references—constitutes a solicitation, recommendation, endorsement, advertisement, or offer to buy or sell any securities, franchises, or other financial instruments, particularly in jurisdictions where such activity would be unlawful.
All content is of a general nature and may not address the specific circumstances of any individual or entity. It is not a substitute for professional advice or services. Any actions you take based on the information provided here are strictly at your own risk. You accept full responsibility for any decisions or outcomes arising from your use of this website and agree to release us from any liability in connection with your use of, or reliance upon, the content or products found herein.