
|
Liberty TripAdvisor Holdings ، Inc. (LTRPA) DCF تقييم |
Fully Editable: Tailor To Your Needs In Excel Or Sheets
Professional Design: Trusted, Industry-Standard Templates
Investor-Approved Valuation Models
MAC/PC Compatible, Fully Unlocked
No Expertise Is Needed; Easy To Follow
Liberty TripAdvisor Holdings, Inc. (LTRPA) Bundle
كمستثمر أو محلل ، فإن حاسبة DCF (LTRPA) هذه هي المورد المثالي للتقييم الدقيق. محملة بالبيانات الحقيقية من Liberty TripAdvisor Holdings ، Inc. ، يمكنك ضبط التوقعات ومراقبة الآثار على الفور.
What You Will Get
- Real LTRPA Financials: Access historical and projected data for precise valuation.
- Adjustable Inputs: Customize WACC, tax rates, revenue growth, and capital expenditures.
- Automatic Calculations: Intrinsic value and NPV are computed in real-time.
- Scenario Analysis: Explore various scenarios to assess Liberty TripAdvisor's future performance.
- Clear and Intuitive Design: Designed for professionals while remaining user-friendly for newcomers.
Key Features
- Real-Life LTRPA Data: Pre-filled with Liberty TripAdvisor Holdings' historical financials and forward-looking projections.
- Fully Customizable Inputs: Adjust revenue growth, margins, WACC, tax rates, and capital expenditures to suit your analysis.
- Dynamic Valuation Model: Automatic updates to Net Present Value (NPV) and intrinsic value based on your customized inputs.
- Scenario Testing: Create multiple forecast scenarios to evaluate various valuation outcomes.
- User-Friendly Design: Intuitive, structured layout designed for both professionals and beginners.
How It Works
- Download: Get the pre-formatted Excel file containing Liberty TripAdvisor Holdings, Inc.'s (LTRPA) financial data.
- Customize: Modify projections, including revenue growth, EBITDA %, and WACC as needed.
- Update Automatically: The intrinsic value and NPV calculations refresh in real-time.
- Test Scenarios: Generate various forecasts and assess results immediately.
- Make Decisions: Utilize the valuation insights to inform your investment strategy.
Why Choose This Calculator for Liberty TripAdvisor Holdings, Inc. (LTRPA)?
- Designed for Experts: A sophisticated tool favored by financial analysts, CFOs, and industry consultants.
- Accurate Financial Data: Historical and projected financials for Liberty TripAdvisor preloaded for precision.
- Flexible Scenario Analysis: Effortlessly test various forecasts and assumptions.
- Comprehensive Outputs: Automatically computes intrinsic value, NPV, and essential financial metrics.
- User-Friendly Interface: Step-by-step guidance to simplify the calculation process.
Who Should Use This Product?
- Investors: Accurately assess Liberty TripAdvisor's fair value before making investment choices.
- CFOs: Utilize a professional-grade DCF model for comprehensive financial reporting and analysis.
- Consultants: Easily customize the template for valuation reports tailored to clients.
- Entrepreneurs: Acquire insights into financial modeling practices used by leading companies.
- Educators: Employ it as a teaching resource to illustrate valuation methodologies.
What the Template Contains
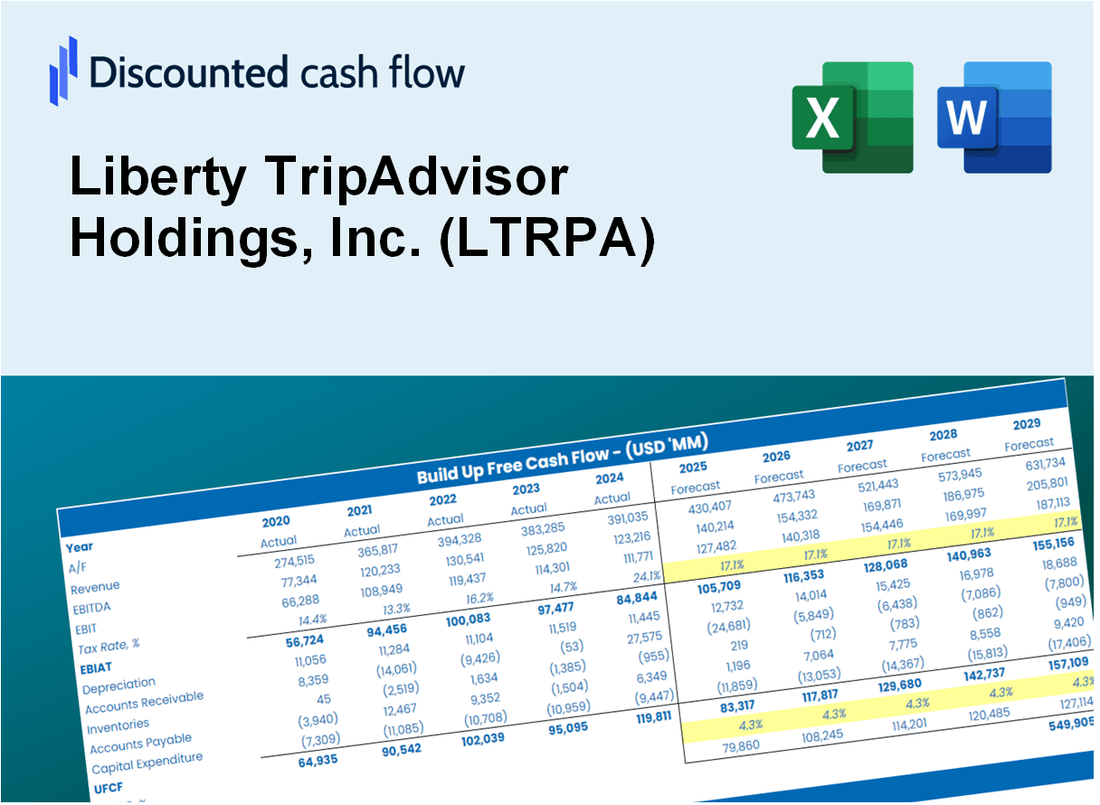
- Preloaded LTRPA Data: Historical and projected financial data, including revenue, EBIT, and capital expenditures.
- DCF and WACC Models: Professional-grade sheets for calculating intrinsic value and Weighted Average Cost of Capital.
- Editable Inputs: Yellow-highlighted cells for adjusting revenue growth, tax rates, and discount rates.
- Financial Statements: Comprehensive annual and quarterly financials for deeper analysis.
- Key Ratios: Profitability, leverage, and efficiency ratios to evaluate performance.
- Dashboard and Charts: Visual summaries of valuation outcomes and assumptions.
Disclaimer
All information, articles, and product details provided on this website are for general informational and educational purposes only. We do not claim any ownership over, nor do we intend to infringe upon, any trademarks, copyrights, logos, brand names, or other intellectual property mentioned or depicted on this site. Such intellectual property remains the property of its respective owners, and any references here are made solely for identification or informational purposes, without implying any affiliation, endorsement, or partnership.
We make no representations or warranties, express or implied, regarding the accuracy, completeness, or suitability of any content or products presented. Nothing on this website should be construed as legal, tax, investment, financial, medical, or other professional advice. In addition, no part of this site—including articles or product references—constitutes a solicitation, recommendation, endorsement, advertisement, or offer to buy or sell any securities, franchises, or other financial instruments, particularly in jurisdictions where such activity would be unlawful.
All content is of a general nature and may not address the specific circumstances of any individual or entity. It is not a substitute for professional advice or services. Any actions you take based on the information provided here are strictly at your own risk. You accept full responsibility for any decisions or outcomes arising from your use of this website and agree to release us from any liability in connection with your use of, or reliance upon, the content or products found herein.