
|
Manhattan Associates ، Inc. (MANH) DCF تقييم |
Fully Editable: Tailor To Your Needs In Excel Or Sheets
Professional Design: Trusted, Industry-Standard Templates
Investor-Approved Valuation Models
MAC/PC Compatible, Fully Unlocked
No Expertise Is Needed; Easy To Follow
Manhattan Associates, Inc. (MANH) Bundle
تبحث لتقييم القيمة الجوهرية لـ Manhattan Associates ، Inc.؟ يدمج حاسبة DCF الخاصة بنا (MANH) DCF بيانات العالم الحقيقي مع ميزات تخصيص واسعة ، مما يتيح لك تحسين توقعاتك وتعزيز اختيارات الاستثمار الخاصة بك.
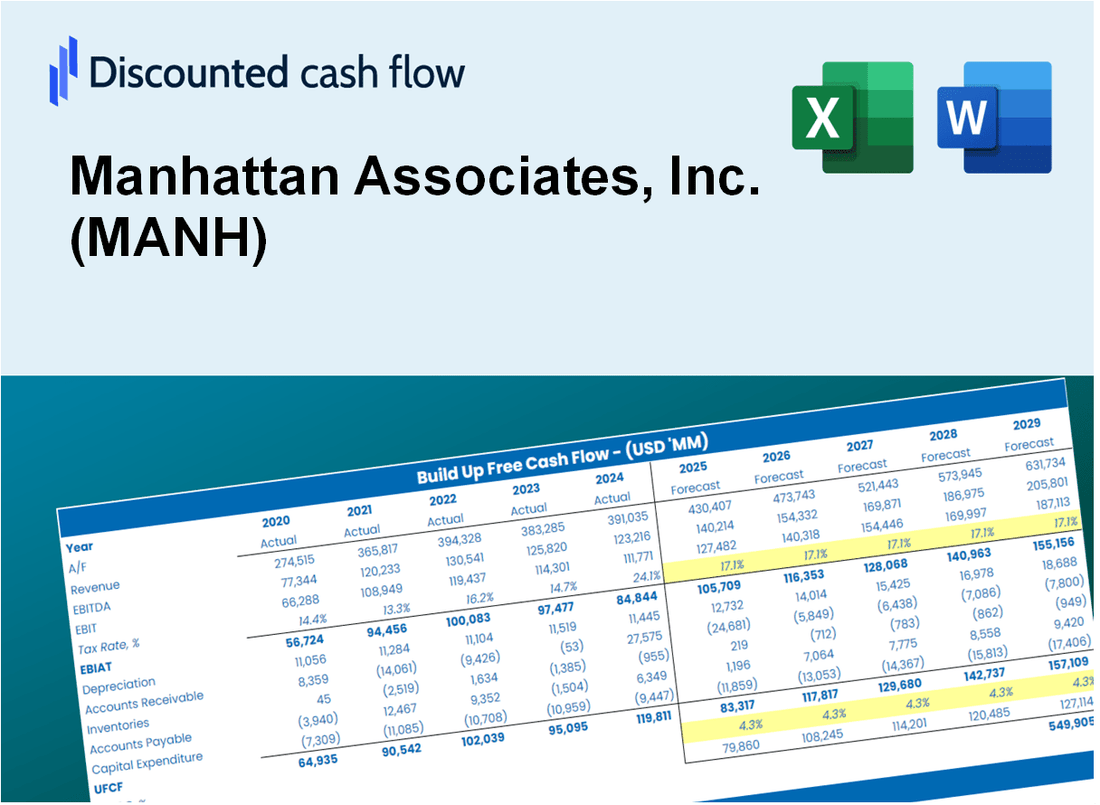
Discounted Cash Flow (DCF) - (USD MM)
| Year | AY1 2020 |
AY2 2021 |
AY3 2022 |
AY4 2023 |
AY5 2024 |
FY1 2025 |
FY2 2026 |
FY3 2027 |
FY4 2028 |
FY5 2029 |
|---|---|---|---|---|---|---|---|---|---|---|
| Revenue | 586.4 | 663.6 | 767.1 | 928.7 | 1,042.4 | 1,204.1 | 1,391.0 | 1,606.8 | 1,856.1 | 2,144.2 |
| Revenue Growth, % | 0 | 13.18 | 15.59 | 21.07 | 12.23 | 15.52 | 15.52 | 15.52 | 15.52 | 15.52 |
| EBITDA | 123.0 | 142.2 | 159.4 | 215.6 | 267.9 | 270.0 | 311.9 | 360.3 | 416.2 | 480.8 |
| EBITDA, % | 20.98 | 21.43 | 20.78 | 23.22 | 25.7 | 22.42 | 22.42 | 22.42 | 22.42 | 22.42 |
| Depreciation | 8.9 | 7.9 | 6.7 | 5.8 | 6.3 | 11.6 | 13.4 | 15.5 | 17.9 | 20.6 |
| Depreciation, % | 1.53 | 1.19 | 0.86861 | 0.61934 | 0.6045 | 0.96212 | 0.96212 | 0.96212 | 0.96212 | 0.96212 |
| EBIT | 114.1 | 134.3 | 152.7 | 209.9 | 261.6 | 258.4 | 298.5 | 344.8 | 398.3 | 460.1 |
| EBIT, % | 19.45 | 20.24 | 19.91 | 22.6 | 25.1 | 21.46 | 21.46 | 21.46 | 21.46 | 21.46 |
| Total Cash | 204.7 | 263.7 | 225.5 | 270.7 | 266.2 | 382.3 | 441.6 | 510.1 | 589.3 | 680.7 |
| Total Cash, percent | .0 | .0 | .0 | .0 | .0 | .0 | .0 | .0 | .0 | .0 |
| Account Receivables | 109.2 | 124.4 | 166.8 | 182.5 | 210.7 | 238.4 | 275.3 | 318.1 | 367.4 | 424.5 |
| Account Receivables, % | 18.62 | 18.75 | 21.74 | 19.66 | 20.21 | 19.8 | 19.8 | 19.8 | 19.8 | 19.8 |
| Inventories | .0 | .0 | .0 | .0 | .0 | .0 | .0 | .0 | .0 | .0 |
| Inventories, % | 0 | 0 | 0 | 0 | 0 | 0 | 0 | 0 | 0 | 0 |
| Accounts Payable | 17.8 | 19.6 | 25.7 | 24.5 | 26.6 | 35.0 | 40.4 | 46.7 | 54.0 | 62.3 |
| Accounts Payable, % | 3.04 | 2.96 | 3.35 | 2.64 | 2.55 | 2.91 | 2.91 | 2.91 | 2.91 | 2.91 |
| Capital Expenditure | -2.7 | -4.0 | -6.6 | -4.7 | -8.7 | -7.9 | -9.1 | -10.5 | -12.1 | -14.0 |
| Capital Expenditure, % | -0.46557 | -0.60514 | -0.85871 | -0.5093 | -0.83225 | -0.6542 | -0.6542 | -0.6542 | -0.6542 | -0.6542 |
| Tax Rate, % | 18.16 | 18.16 | 18.16 | 18.16 | 18.16 | 18.16 | 18.16 | 18.16 | 18.16 | 18.16 |
| EBITAT | 87.5 | 110.7 | 124.5 | 173.4 | 214.1 | 209.4 | 241.8 | 279.4 | 322.7 | 372.8 |
| Depreciation | ||||||||||
| Changes in Account Receivables | ||||||||||
| Changes in Inventories | ||||||||||
| Changes in Accounts Payable | ||||||||||
| Capital Expenditure | ||||||||||
| UFCF | 2.3 | 101.2 | 88.3 | 157.5 | 185.7 | 193.8 | 214.6 | 247.9 | 286.3 | 330.8 |
| WACC, % | 8.84 | 8.84 | 8.84 | 8.84 | 8.84 | 8.84 | 8.84 | 8.84 | 8.84 | 8.84 |
| PV UFCF | ||||||||||
| SUM PV UFCF | 971.9 | |||||||||
| Long Term Growth Rate, % | 4.00 | |||||||||
| Free cash flow (T + 1) | 344 | |||||||||
| Terminal Value | 7,102 | |||||||||
| Present Terminal Value | 4,649 | |||||||||
| Enterprise Value | 5,621 | |||||||||
| Net Debt | -218 | |||||||||
| Equity Value | 5,839 | |||||||||
| Diluted Shares Outstanding, MM | 62 | |||||||||
| Equity Value Per Share | 93.90 |
What You Will Get
- Editable Excel Template: A fully customizable Excel-based DCF Calculator featuring pre-filled real MANH financials.
- Real-World Data: Historical data and forward-looking estimates (as indicated in the yellow cells).
- Forecast Flexibility: Adjust forecast assumptions such as revenue growth, EBITDA %, and WACC.
- Automatic Calculations: Instantly observe the effect of your inputs on Manhattan Associates' valuation.
- Professional Tool: Designed for investors, CFOs, consultants, and financial analysts.
- User-Friendly Design: Organized for clarity and ease of use, complete with step-by-step instructions.
Key Features
- Comprehensive Financial Data: Manhattan Associates’ historical financial statements and pre-filled projections.
- Customizable Parameters: Modify WACC, tax rates, revenue growth, and EBITDA margins to suit your analysis.
- Real-Time Calculations: Monitor Manhattan Associates’ intrinsic value as it updates instantly.
- Intuitive Visual Outputs: Dashboard graphs illustrate valuation outcomes and essential metrics.
- Designed for Precision: A robust tool tailored for analysts, investors, and financial professionals.
How It Works
- Step 1: Download the Excel file.
- Step 2: Review pre-entered Manhattan Associates data (historical and projected).
- Step 3: Adjust key assumptions (yellow cells) based on your analysis.
- Step 4: View automatic recalculations for Manhattan Associates’ intrinsic value.
- Step 5: Use the outputs for investment decisions or reporting.
Why Choose This Calculator for Manhattan Associates (MANH)?
- Accuracy: Leverages real Manhattan Associates financial data for precise calculations.
- Flexibility: Allows users to easily adjust and test various inputs.
- Time-Saving: Eliminate the need to create a DCF model from the ground up.
- Professional-Grade: Crafted with the expertise and usability expected by financial professionals.
- User-Friendly: Intuitive design suitable for users with varying levels of financial modeling skills.
Who Should Use Manhattan Associates, Inc. (MANH)?
- Supply Chain Managers: Enhance operational efficiency with advanced supply chain solutions.
- Logistics Professionals: Streamline processes using innovative technology tailored for logistics management.
- Consultants: Easily customize the platform for client-specific supply chain strategies and presentations.
- Business Analysts: Gain insights into data-driven decision-making with real-time analytics tools.
- Students and Educators: Utilize it as a comprehensive resource for learning about supply chain management principles.
What the Template Contains
- Comprehensive DCF Model: Editable template with detailed valuation calculations tailored for Manhattan Associates, Inc. (MANH).
- Real-World Data: Manhattan Associates' historical and projected financials preloaded for analysis.
- Customizable Parameters: Adjust WACC, growth rates, and tax assumptions to explore various scenarios.
- Financial Statements: Complete annual and quarterly breakdowns for in-depth insights.
- Key Ratios: Integrated analysis for profitability, efficiency, and leverage metrics.
- Dashboard with Visual Outputs: Charts and tables designed for clear, actionable results.
Disclaimer
All information, articles, and product details provided on this website are for general informational and educational purposes only. We do not claim any ownership over, nor do we intend to infringe upon, any trademarks, copyrights, logos, brand names, or other intellectual property mentioned or depicted on this site. Such intellectual property remains the property of its respective owners, and any references here are made solely for identification or informational purposes, without implying any affiliation, endorsement, or partnership.
We make no representations or warranties, express or implied, regarding the accuracy, completeness, or suitability of any content or products presented. Nothing on this website should be construed as legal, tax, investment, financial, medical, or other professional advice. In addition, no part of this site—including articles or product references—constitutes a solicitation, recommendation, endorsement, advertisement, or offer to buy or sell any securities, franchises, or other financial instruments, particularly in jurisdictions where such activity would be unlawful.
All content is of a general nature and may not address the specific circumstances of any individual or entity. It is not a substitute for professional advice or services. Any actions you take based on the information provided here are strictly at your own risk. You accept full responsibility for any decisions or outcomes arising from your use of this website and agree to release us from any liability in connection with your use of, or reliance upon, the content or products found herein.