
|
Metrocity Bankshares ، Inc. (MCBS) DCF تقييم |
Fully Editable: Tailor To Your Needs In Excel Or Sheets
Professional Design: Trusted, Industry-Standard Templates
Investor-Approved Valuation Models
MAC/PC Compatible, Fully Unlocked
No Expertise Is Needed; Easy To Follow
MetroCity Bankshares, Inc. (MCBS) Bundle
اكتشف الإمكانات الحقيقية لشركة MetroCity Bankshares، Inc. (MCBS) مع حاسبة DCF المتقدمة! ضبط الافتراضات الرئيسية، واستكشاف السيناريوهات المختلفة، وتقييم كيفية تأثير العوامل المختلفة على تقييم MetroCity Bankshares، Inc. (MCBS) - كل ذلك ضمن نموذج Excel شامل واحد.
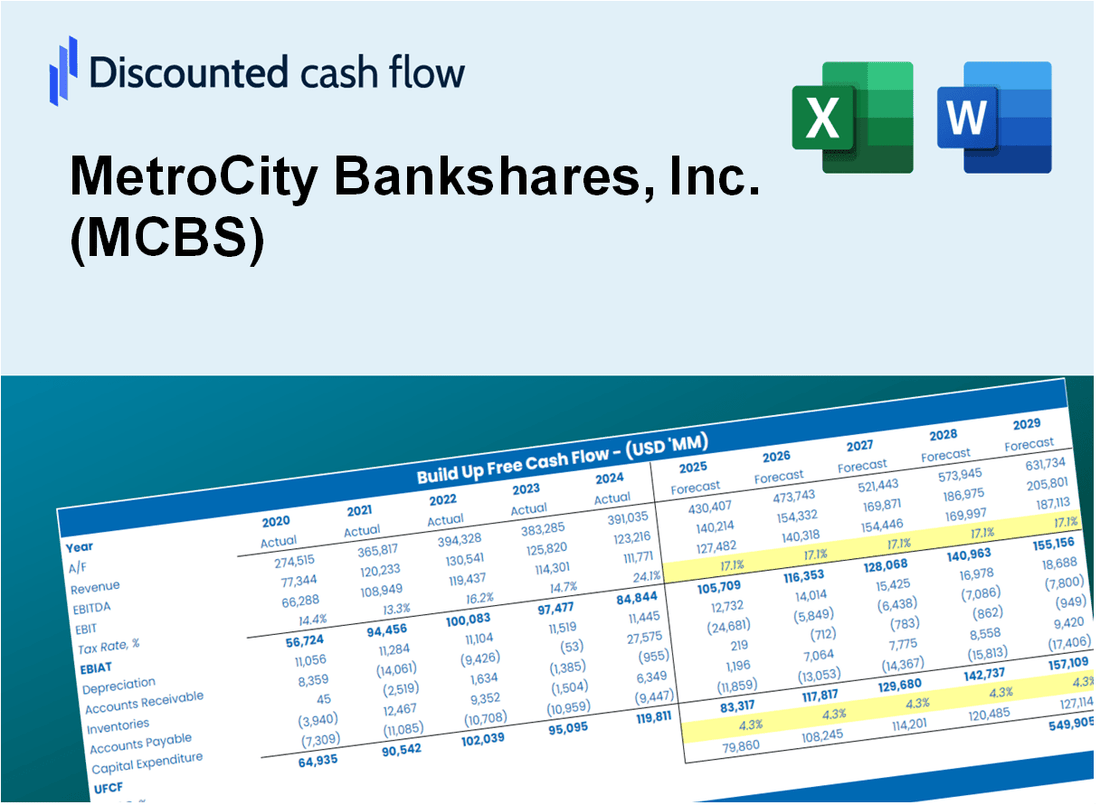
Discounted Cash Flow (DCF) - (USD MM)
| Year | AY1 2020 |
AY2 2021 |
AY3 2022 |
AY4 2023 |
AY5 2024 |
FY1 2025 |
FY2 2026 |
FY3 2027 |
FY4 2028 |
FY5 2029 |
|---|---|---|---|---|---|---|---|---|---|---|
| Revenue | 103.0 | 139.2 | 162.3 | 209.4 | 234.4 | 288.8 | 355.8 | 438.3 | 539.9 | 665.2 |
| Revenue Growth, % | 0 | 35.21 | 16.58 | 29.02 | 11.96 | 23.19 | 23.19 | 23.19 | 23.19 | 23.19 |
| EBITDA | 51.7 | 85.4 | 95.1 | 74.7 | 90.3 | 141.1 | 173.9 | 214.2 | 263.9 | 325.1 |
| EBITDA, % | 50.21 | 61.37 | 58.6 | 35.66 | 38.51 | 48.87 | 48.87 | 48.87 | 48.87 | 48.87 |
| Depreciation | 2.9 | 2.8 | 3.9 | 2.7 | 3.0 | 5.7 | 7.0 | 8.6 | 10.6 | 13.0 |
| Depreciation, % | 2.84 | 2.02 | 2.39 | 1.28 | 1.26 | 1.96 | 1.96 | 1.96 | 1.96 | 1.96 |
| EBIT | 48.8 | 82.6 | 91.2 | 72.0 | 87.3 | 135.5 | 166.9 | 205.6 | 253.3 | 312.0 |
| EBIT, % | 47.36 | 59.35 | 56.21 | 34.37 | 37.25 | 46.91 | 46.91 | 46.91 | 46.91 | 46.91 |
| Total Cash | 158.9 | 458.3 | 170.2 | 160.6 | 253.7 | 275.4 | 339.2 | 417.9 | 514.8 | 634.2 |
| Total Cash, percent | .0 | .0 | .0 | .0 | .0 | .0 | .0 | .0 | .0 | .0 |
| Account Receivables | 10.7 | 11.1 | 13.2 | 15.1 | 15.9 | 23.3 | 28.8 | 35.4 | 43.6 | 53.8 |
| Account Receivables, % | 10.36 | 7.94 | 8.12 | 7.22 | 6.76 | 8.08 | 8.08 | 8.08 | 8.08 | 8.08 |
| Inventories | .0 | .0 | .0 | .0 | .0 | .0 | .0 | .0 | .0 | .0 |
| Inventories, % | 0 | 0 | 0 | 0 | 0 | 0 | 0 | 0 | 0 | 0 |
| Accounts Payable | .2 | .2 | 2.7 | 4.1 | 3.5 | 3.2 | 3.9 | 4.8 | 6.0 | 7.3 |
| Accounts Payable, % | 0.21562 | 0.14654 | 1.69 | 1.97 | 1.49 | 1.1 | 1.1 | 1.1 | 1.1 | 1.1 |
| Capital Expenditure | -.5 | -.4 | -2.4 | -4.9 | -1.3 | -3.0 | -3.7 | -4.5 | -5.6 | -6.9 |
| Capital Expenditure, % | -0.52158 | -0.27585 | -1.45 | -2.36 | -0.54857 | -1.03 | -1.03 | -1.03 | -1.03 | -1.03 |
| Tax Rate, % | 26.12 | 26.12 | 26.12 | 26.12 | 26.12 | 26.12 | 26.12 | 26.12 | 26.12 | 26.12 |
| EBITAT | 36.4 | 61.7 | 62.6 | 51.6 | 64.5 | 98.5 | 121.3 | 149.5 | 184.1 | 226.9 |
| Depreciation | ||||||||||
| Changes in Account Receivables | ||||||||||
| Changes in Inventories | ||||||||||
| Changes in Accounts Payable | ||||||||||
| Capital Expenditure | ||||||||||
| UFCF | 28.3 | 63.7 | 64.5 | 48.8 | 64.8 | 93.4 | 120.0 | 147.8 | 182.1 | 224.3 |
| WACC, % | 11.08 | 11.08 | 10.53 | 10.81 | 11.01 | 10.9 | 10.9 | 10.9 | 10.9 | 10.9 |
| PV UFCF | ||||||||||
| SUM PV UFCF | 544.1 | |||||||||
| Long Term Growth Rate, % | 2.00 | |||||||||
| Free cash flow (T + 1) | 229 | |||||||||
| Terminal Value | 2,570 | |||||||||
| Present Terminal Value | 1,532 | |||||||||
| Enterprise Value | 2,076 | |||||||||
| Net Debt | 147 | |||||||||
| Equity Value | 1,929 | |||||||||
| Diluted Shares Outstanding, MM | 26 | |||||||||
| Equity Value Per Share | 75.41 |
What You Will Get
- Pre-Filled Financial Model: MetroCity Bankshares, Inc.'s (MCBS) actual data provides an accurate DCF valuation.
- Full Forecast Control: Modify revenue growth, profit margins, WACC, and other essential drivers.
- Instant Calculations: Real-time updates ensure you see the outcomes as you adjust inputs.
- Investor-Ready Template: A polished Excel file crafted for professional-level valuation.
- Customizable and Reusable: Designed for adaptability, allowing repeated use for in-depth forecasts.
Key Features
- Comprehensive DCF Calculator: Features detailed unlevered and levered DCF valuation models tailored for MetroCity Bankshares, Inc. (MCBS).
- WACC Calculator: Pre-configured Weighted Average Cost of Capital sheet with adjustable inputs for precise calculations.
- Customizable Forecast Assumptions: Adjust growth rates, capital expenditures, and discount rates to fit your analysis.
- Integrated Financial Ratios: Evaluate profitability, leverage, and efficiency ratios specific to MetroCity Bankshares, Inc. (MCBS).
- Interactive Dashboard and Charts: Visual representations summarize essential valuation metrics for streamlined analysis.
How It Works
- Step 1: Download the Excel file.
- Step 2: Review MetroCity Bankshares, Inc.'s (MCBS) pre-filled financial data and forecasts.
- Step 3: Modify critical inputs like revenue growth, WACC, and tax rates (highlighted cells).
- Step 4: Watch the DCF model update instantly as you tweak assumptions.
- Step 5: Analyze the outputs and use the results for investment decisions.
Why Choose MetroCity Bankshares, Inc. (MCBS)?
- Save Time: Skip the hassle of building financial models from the ground up – we provide ready-to-use solutions.
- Enhance Precision: Our reliable data and formulas help minimize valuation errors.
- Completely Customizable: Adjust the model to align with your specific assumptions and forecasts.
- User-Friendly: Intuitive charts and outputs simplify the analysis of results.
- Endorsed by Professionals: Crafted for experts who prioritize accuracy and ease of use.
Who Should Use This Product?
- Investors: Accurately assess MetroCity Bankshares, Inc.'s (MCBS) fair value prior to making investment choices.
- CFOs: Utilize a top-tier DCF model for comprehensive financial reporting and analysis.
- Consultants: Easily customize the template for client valuation reports.
- Entrepreneurs: Acquire knowledge on financial modeling practices utilized by leading financial institutions.
- Educators: Employ it as a pedagogical resource to illustrate valuation techniques.
What the Template Contains
- Pre-Filled Data: Includes MetroCity Bankshares, Inc.'s (MCBS) historical financials and forecasts.
- Discounted Cash Flow Model: Editable DCF valuation model with automatic calculations tailored for (MCBS).
- Weighted Average Cost of Capital (WACC): A dedicated sheet for calculating WACC based on custom inputs specific to (MCBS).
- Key Financial Ratios: Analyze MetroCity Bankshares, Inc.'s (MCBS) profitability, efficiency, and leverage.
- Customizable Inputs: Edit revenue growth, margins, and tax rates easily for (MCBS).
- Clear Dashboard: Charts and tables summarizing key valuation results for (MCBS).
Disclaimer
All information, articles, and product details provided on this website are for general informational and educational purposes only. We do not claim any ownership over, nor do we intend to infringe upon, any trademarks, copyrights, logos, brand names, or other intellectual property mentioned or depicted on this site. Such intellectual property remains the property of its respective owners, and any references here are made solely for identification or informational purposes, without implying any affiliation, endorsement, or partnership.
We make no representations or warranties, express or implied, regarding the accuracy, completeness, or suitability of any content or products presented. Nothing on this website should be construed as legal, tax, investment, financial, medical, or other professional advice. In addition, no part of this site—including articles or product references—constitutes a solicitation, recommendation, endorsement, advertisement, or offer to buy or sell any securities, franchises, or other financial instruments, particularly in jurisdictions where such activity would be unlawful.
All content is of a general nature and may not address the specific circumstances of any individual or entity. It is not a substitute for professional advice or services. Any actions you take based on the information provided here are strictly at your own risk. You accept full responsibility for any decisions or outcomes arising from your use of this website and agree to release us from any liability in connection with your use of, or reliance upon, the content or products found herein.