
|
Medtronic PLC (MDT) تقييم DCF |
Fully Editable: Tailor To Your Needs In Excel Or Sheets
Professional Design: Trusted, Industry-Standard Templates
Investor-Approved Valuation Models
MAC/PC Compatible, Fully Unlocked
No Expertise Is Needed; Easy To Follow
Medtronic plc (MDT) Bundle
اكتشف القيمة الحقيقية لـ Medtronic PLC (MDT) مع حاسبة DCF من الدرجة المهنية! اضبط الافتراضات الأساسية واستكشاف السيناريوهات المختلفة وتقييم كيفية تأثير التغييرات على تقييم Medtronic PLC (MDT) - كل ذلك ضمن قالب Excel واحد.
What You Will Get
- Comprehensive MDT Financials: Access both historical and projected data for precise valuation.
- Customizable Inputs: Adjust WACC, tax rates, revenue growth, and capital expenditures as needed.
- Real-Time Calculations: Intrinsic value and NPV are computed automatically.
- Scenario Analysis: Explore various scenarios to assess Medtronic’s future performance.
- User-Friendly Design: Designed for professionals while remaining approachable for newcomers.
Key Features
- 🔍 Real-Life MDT Financials: Pre-filled historical and projected data for Medtronic plc (MDT).
- ✏️ Fully Customizable Inputs: Adjust all critical parameters (yellow cells) like WACC, growth %, and tax rates.
- 📊 Professional DCF Valuation: Built-in formulas calculate Medtronic’s intrinsic value using the Discounted Cash Flow method.
- ⚡ Instant Results: Visualize Medtronic’s valuation instantly after making changes.
- Scenario Analysis: Test and compare outcomes for various financial assumptions side-by-side.
How It Works
- Download: Get the pre-built Excel file containing Medtronic's financial data.
- Customize: Modify forecasts such as revenue growth, EBITDA %, and WACC to fit your analysis.
- Update Automatically: Watch as the intrinsic value and NPV calculations refresh in real-time.
- Test Scenarios: Develop various projections and quickly compare different outcomes.
- Make Decisions: Leverage the valuation results to inform your investment approach.
Why Choose Medtronic plc (MDT)?
- Innovative Solutions: Cutting-edge medical technologies that enhance patient care.
- Global Reach: Operates in over 150 countries, ensuring accessibility to healthcare solutions.
- Commitment to Quality: Rigorous standards and testing processes guarantee product reliability.
- Patient-Centric Approach: Focused on improving outcomes and quality of life for patients.
- Industry Leader: Recognized for excellence and trusted by healthcare professionals worldwide.
Who Should Use This Product?
- Investors: Accurately estimate Medtronic plc’s (MDT) fair value before making investment decisions.
- CFOs: Utilize a professional-grade DCF model for financial reporting and analysis of Medtronic plc (MDT).
- Consultants: Quickly adapt the template for valuation reports tailored to clients interested in Medtronic plc (MDT).
- Entrepreneurs: Gain insights into financial modeling practices employed by industry leaders like Medtronic plc (MDT).
- Educators: Use it as a teaching tool to illustrate valuation methodologies relevant to Medtronic plc (MDT).
What the Template Contains
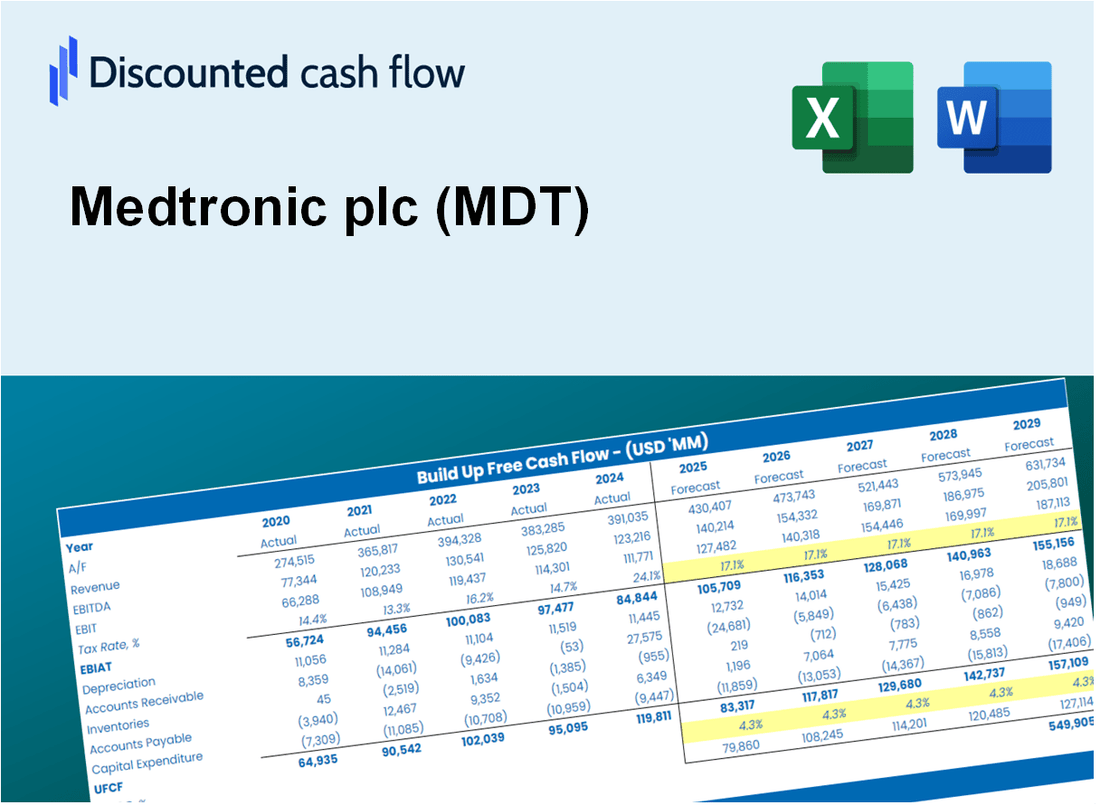
- Operating and Balance Sheet Data: Pre-filled Medtronic plc (MDT) historical data and forecasts, including revenue, EBITDA, EBIT, and capital expenditures.
- WACC Calculation: A dedicated sheet for Weighted Average Cost of Capital (WACC), including parameters like Beta, risk-free rate, and share price.
- DCF Valuation (Unlevered and Levered): Editable Discounted Cash Flow models showing intrinsic value with detailed calculations.
- Financial Statements: Pre-loaded financial statements (annual and quarterly) to support analysis.
- Key Ratios: Includes profitability, leverage, and efficiency ratios for Medtronic plc (MDT).
- Dashboard and Charts: Visual summary of valuation outputs and assumptions to analyze results easily.
Disclaimer
All information, articles, and product details provided on this website are for general informational and educational purposes only. We do not claim any ownership over, nor do we intend to infringe upon, any trademarks, copyrights, logos, brand names, or other intellectual property mentioned or depicted on this site. Such intellectual property remains the property of its respective owners, and any references here are made solely for identification or informational purposes, without implying any affiliation, endorsement, or partnership.
We make no representations or warranties, express or implied, regarding the accuracy, completeness, or suitability of any content or products presented. Nothing on this website should be construed as legal, tax, investment, financial, medical, or other professional advice. In addition, no part of this site—including articles or product references—constitutes a solicitation, recommendation, endorsement, advertisement, or offer to buy or sell any securities, franchises, or other financial instruments, particularly in jurisdictions where such activity would be unlawful.
All content is of a general nature and may not address the specific circumstances of any individual or entity. It is not a substitute for professional advice or services. Any actions you take based on the information provided here are strictly at your own risk. You accept full responsibility for any decisions or outcomes arising from your use of this website and agree to release us from any liability in connection with your use of, or reliance upon, the content or products found herein.