
|
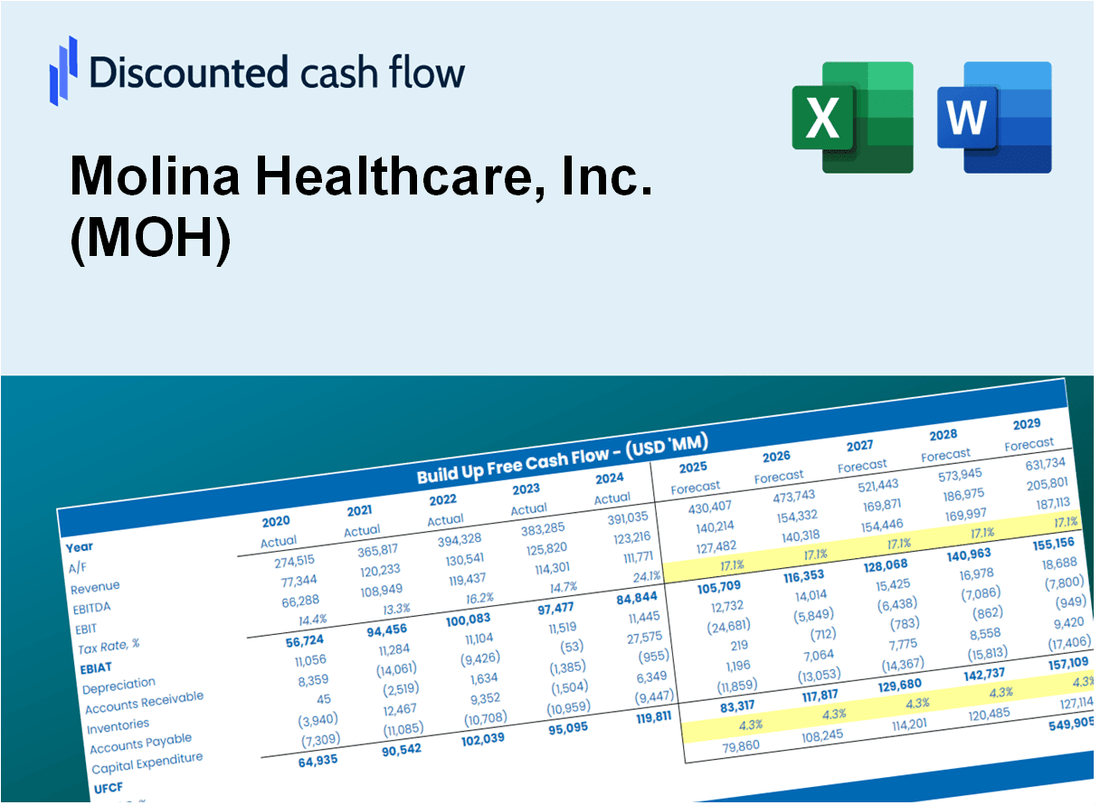
Molina Healthcare ، Inc. (MOH) DCF تقييم |
Fully Editable: Tailor To Your Needs In Excel Or Sheets
Professional Design: Trusted, Industry-Standard Templates
Investor-Approved Valuation Models
MAC/PC Compatible, Fully Unlocked
No Expertise Is Needed; Easy To Follow
Molina Healthcare, Inc. (MOH) Bundle
قم بتحسين وقتك وتحسين الدقة من خلال حاسبة (MOH) DCF! باستخدام بيانات Molina Healthcare الأصيلة والافتراضات القابلة للتخصيص ، تمكنك هذه الأداة من التنبؤ وتحليل وقيمة الرعاية الصحية Molina مثل المستثمر المحنك.
Discounted Cash Flow (DCF) - (USD MM)
| Year | AY1 2020 |
AY2 2021 |
AY3 2022 |
AY4 2023 |
AY5 2024 |
FY1 2025 |
FY2 2026 |
FY3 2027 |
FY4 2028 |
FY5 2029 |
|---|---|---|---|---|---|---|---|---|---|---|
| Revenue | 19,423.0 | 27,771.0 | 31,974.0 | 34,072.0 | 40,650.0 | 42,630.7 | 44,707.8 | 46,886.2 | 49,170.7 | 51,566.6 |
| Revenue Growth, % | 0 | 42.98 | 15.13 | 6.56 | 19.31 | 4.87 | 4.87 | 4.87 | 4.87 | 4.87 |
| EBITDA | 1,151.0 | 1,126.0 | 1,349.0 | 1,744.0 | 1,893.0 | 2,044.1 | 2,143.7 | 2,248.2 | 2,357.7 | 2,472.6 |
| EBITDA, % | 5.93 | 4.05 | 4.22 | 5.12 | 4.66 | 4.8 | 4.8 | 4.8 | 4.8 | 4.8 |
| Depreciation | 88.0 | 131.0 | 176.0 | 171.0 | 186.0 | 207.6 | 217.7 | 228.3 | 239.4 | 251.1 |
| Depreciation, % | 0.45307 | 0.47172 | 0.55045 | 0.50188 | 0.45756 | 0.48694 | 0.48694 | 0.48694 | 0.48694 | 0.48694 |
| EBIT | 1,063.0 | 995.0 | 1,173.0 | 1,573.0 | 1,707.0 | 1,836.6 | 1,926.0 | 2,019.9 | 2,118.3 | 2,221.5 |
| EBIT, % | 5.47 | 3.58 | 3.67 | 4.62 | 4.2 | 4.31 | 4.31 | 4.31 | 4.31 | 4.31 |
| Total Cash | 6,029.0 | 7,640.0 | 7,505.0 | 9,107.0 | 8,987.0 | 11,157.3 | 11,701.0 | 12,271.1 | 12,869.0 | 13,496.0 |
| Total Cash, percent | .0 | .0 | .0 | .0 | .0 | .0 | .0 | .0 | .0 | .0 |
| Account Receivables | 1,672.0 | 2,177.0 | 2,302.0 | 3,104.0 | 3,299.0 | 3,484.9 | 3,654.7 | 3,832.7 | 4,019.5 | 4,215.3 |
| Account Receivables, % | 8.61 | 7.84 | 7.2 | 9.11 | 8.12 | 8.17 | 8.17 | 8.17 | 8.17 | 8.17 |
| Inventories | .0 | .0 | .0 | .0 | .0 | .0 | .0 | .0 | .0 | .0 |
| Inventories, % | 0 | 0 | 0 | 0 | 0 | 0 | 0 | 0 | 0 | 0 |
| Accounts Payable | 641.0 | 842.0 | 889.0 | 1,252.0 | 1,331.0 | 1,369.4 | 1,436.1 | 1,506.1 | 1,579.5 | 1,656.5 |
| Accounts Payable, % | 3.3 | 3.03 | 2.78 | 3.67 | 3.27 | 3.21 | 3.21 | 3.21 | 3.21 | 3.21 |
| Capital Expenditure | -74.0 | -77.0 | -91.0 | -84.0 | -100.0 | -122.4 | -128.3 | -134.6 | -141.2 | -148.0 |
| Capital Expenditure, % | -0.38099 | -0.27727 | -0.28461 | -0.24654 | -0.246 | -0.28708 | -0.28708 | -0.28708 | -0.28708 | -0.28708 |
| Tax Rate, % | 25.8 | 25.8 | 25.8 | 25.8 | 25.8 | 25.8 | 25.8 | 25.8 | 25.8 | 25.8 |
| EBITAT | 744.4 | 749.4 | 874.0 | 1,172.2 | 1,266.6 | 1,353.8 | 1,419.8 | 1,488.9 | 1,561.5 | 1,637.6 |
| Depreciation | ||||||||||
| Changes in Account Receivables | ||||||||||
| Changes in Inventories | ||||||||||
| Changes in Accounts Payable | ||||||||||
| Capital Expenditure | ||||||||||
| UFCF | -272.6 | 499.4 | 881.0 | 820.2 | 1,236.6 | 1,291.5 | 1,406.0 | 1,474.6 | 1,546.4 | 1,621.7 |
| WACC, % | 5.17 | 5.23 | 5.22 | 5.22 | 5.22 | 5.21 | 5.21 | 5.21 | 5.21 | 5.21 |
| PV UFCF | ||||||||||
| SUM PV UFCF | 6,284.1 | |||||||||
| Long Term Growth Rate, % | 3.00 | |||||||||
| Free cash flow (T + 1) | 1,670 | |||||||||
| Terminal Value | 75,573 | |||||||||
| Present Terminal Value | 58,624 | |||||||||
| Enterprise Value | 64,908 | |||||||||
| Net Debt | -1,544 | |||||||||
| Equity Value | 66,452 | |||||||||
| Diluted Shares Outstanding, MM | 58 | |||||||||
| Equity Value Per Share | 1,151.68 |
What You Will Get
- Editable Forecast Inputs: Easily modify assumptions (growth %, margins, WACC) to develop various scenarios.
- Real-World Data: Molina Healthcare’s financial data pre-loaded to accelerate your analysis.
- Automatic DCF Outputs: The template computes Net Present Value (NPV) and intrinsic value for you.
- Customizable and Professional: A refined Excel model that adjusts to your valuation requirements.
- Built for Analysts and Investors: Perfect for evaluating projections, confirming strategies, and saving time.
Key Features
- Customizable Financial Inputs: Adjust essential parameters such as membership growth, medical loss ratio, and administrative costs.
- Instant DCF Valuation: Quickly computes intrinsic value, net present value, and additional financial metrics.
- High Precision Results: Leverages Molina Healthcare's actual financial data for accurate valuation insights.
- Simplified Scenario Analysis: Easily evaluate various assumptions and analyze the resulting financial outcomes.
- Efficiency Booster: Streamline your valuation process without the hassle of creating intricate models from the ground up.
How It Works
- Step 1: Download the Excel file.
- Step 2: Review Molina Healthcare’s pre-filled financial data and forecasts.
- Step 3: Modify critical inputs like revenue growth, WACC, and tax rates (highlighted cells).
- Step 4: Watch the DCF model update instantly as you tweak assumptions.
- Step 5: Analyze the outputs and use the results for investment decisions regarding Molina Healthcare, Inc. (MOH).
Why Choose Molina Healthcare's Calculator?
- Comprehensive Tool: Offers detailed analyses including DCF, WACC, and key financial ratios all in one solution.
- Customizable Inputs: Easily modify the yellow-highlighted fields to explore different financial scenarios.
- Detailed Insights: Automatically computes Molina Healthcare's intrinsic value and Net Present Value for informed decision-making.
- Preloaded Data: Historical and projected data provide reliable starting points for analysis.
- Professional Quality: Perfect for financial analysts, investors, and healthcare industry consultants.
Who Should Use This Product?
- Healthcare Investors: Develop comprehensive valuation models for assessing Molina Healthcare, Inc. (MOH) stock.
- Corporate Finance Teams: Evaluate valuation scenarios to inform strategic decisions within the healthcare sector.
- Consultants and Advisors: Deliver precise valuation insights to clients interested in Molina Healthcare, Inc. (MOH).
- Students and Educators: Utilize real-world healthcare data for practicing and teaching financial modeling techniques.
- Health Policy Enthusiasts: Gain insights into how healthcare companies like Molina Healthcare, Inc. (MOH) are valued in the marketplace.
What the Template Contains
- Pre-Filled Data: Contains Molina Healthcare’s historical financials and projections.
- Discounted Cash Flow Model: Editable DCF valuation model with automatic calculations.
- Weighted Average Cost of Capital (WACC): A dedicated sheet for calculating WACC based on custom inputs.
- Key Financial Ratios: Assess Molina Healthcare’s profitability, efficiency, and leverage.
- Customizable Inputs: Easily modify revenue growth, margins, and tax rates.
- Clear Dashboard: Visuals and tables summarizing key valuation outcomes.
Disclaimer
All information, articles, and product details provided on this website are for general informational and educational purposes only. We do not claim any ownership over, nor do we intend to infringe upon, any trademarks, copyrights, logos, brand names, or other intellectual property mentioned or depicted on this site. Such intellectual property remains the property of its respective owners, and any references here are made solely for identification or informational purposes, without implying any affiliation, endorsement, or partnership.
We make no representations or warranties, express or implied, regarding the accuracy, completeness, or suitability of any content or products presented. Nothing on this website should be construed as legal, tax, investment, financial, medical, or other professional advice. In addition, no part of this site—including articles or product references—constitutes a solicitation, recommendation, endorsement, advertisement, or offer to buy or sell any securities, franchises, or other financial instruments, particularly in jurisdictions where such activity would be unlawful.
All content is of a general nature and may not address the specific circumstances of any individual or entity. It is not a substitute for professional advice or services. Any actions you take based on the information provided here are strictly at your own risk. You accept full responsibility for any decisions or outcomes arising from your use of this website and agree to release us from any liability in connection with your use of, or reliance upon, the content or products found herein.