
|
Melrose Industries PLC (MRO.L) DCF تقييم |
Fully Editable: Tailor To Your Needs In Excel Or Sheets
Professional Design: Trusted, Industry-Standard Templates
Investor-Approved Valuation Models
MAC/PC Compatible, Fully Unlocked
No Expertise Is Needed; Easy To Follow
Melrose Industries PLC (MRO.L) Bundle
اكتساب نظرة ثاقبة على تحليل تقييم Melrose Industries PLC (MROL) باستخدام حاسبة DCF المتطورة لدينا! تم التحميل المسبق لبيانات MROL دقيقة ، يمكّنك هذا القالب Excel من ضبط التوقعات والافتراضات لتحديد القيمة الجوهرية لصناعات Melrose بدقة.
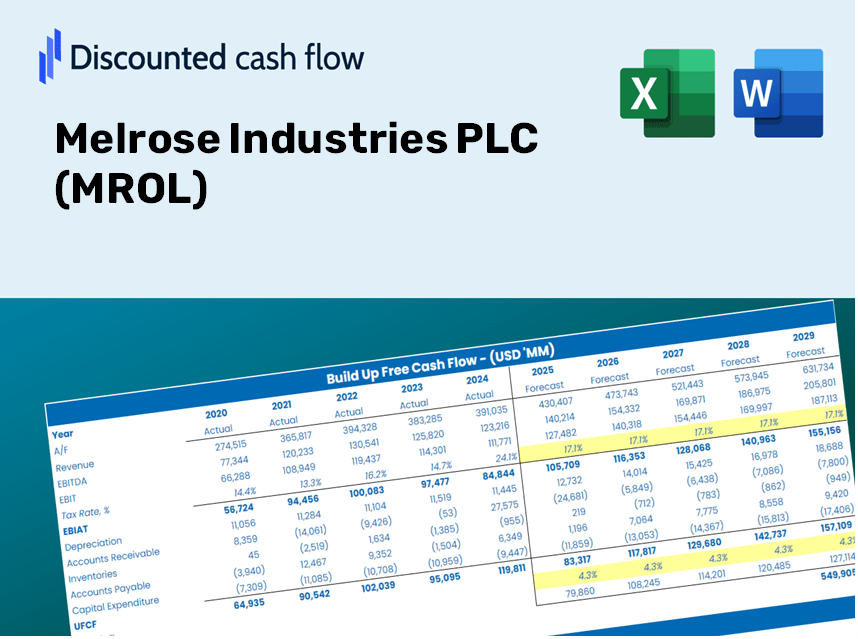
Discounted Cash Flow (DCF) - (USD MM)
| Year | AY1 2020 |
AY2 2021 |
AY3 2022 |
AY4 2023 |
AY5 2024 |
FY1 2025 |
FY2 2026 |
FY3 2027 |
FY4 2028 |
FY5 2029 |
|---|---|---|---|---|---|---|---|---|---|---|
| Revenue | 7,132.0 | 6,650.0 | 7,537.0 | 3,350.0 | 3,468.0 | 3,073.9 | 2,724.7 | 2,415.1 | 2,140.7 | 1,897.4 |
| Revenue Growth, % | 0 | -6.76 | 13.34 | -55.55 | 3.52 | -11.36 | -11.36 | -11.36 | -11.36 | -11.36 |
| EBITDA | 554.0 | 324.0 | 146.0 | 385.0 | 392.0 | 229.8 | 203.7 | 180.5 | 160.0 | 141.8 |
| EBITDA, % | 7.77 | 4.87 | 1.94 | 11.49 | 11.3 | 7.47 | 7.47 | 7.47 | 7.47 | 7.47 |
| Depreciation | 1,093.0 | 860.0 | 389.0 | 329.0 | 397.0 | 336.2 | 298.0 | 264.1 | 234.1 | 207.5 |
| Depreciation, % | 15.33 | 12.93 | 5.16 | 9.82 | 11.45 | 10.94 | 10.94 | 10.94 | 10.94 | 10.94 |
| EBIT | -539.0 | -536.0 | -243.0 | 56.0 | -5.0 | -106.4 | -94.4 | -83.6 | -74.1 | -65.7 |
| EBIT, % | -7.56 | -8.06 | -3.22 | 1.67 | -0.14418 | -3.46 | -3.46 | -3.46 | -3.46 | -3.46 |
| Total Cash | 311.0 | 473.0 | 355.0 | 58.0 | 88.0 | 125.7 | 111.5 | 98.8 | 87.6 | 77.6 |
| Total Cash, percent | .0 | .0 | .0 | .0 | .0 | .0 | .0 | .0 | .0 | .0 |
| Account Receivables | 1,604.0 | 1,144.0 | 1,961.0 | 518.0 | 921.0 | 662.3 | 587.1 | 520.4 | 461.2 | 408.8 |
| Account Receivables, % | 22.49 | 17.2 | 26.02 | 15.46 | 26.56 | 21.55 | 21.55 | 21.55 | 21.55 | 21.55 |
| Inventories | 1,126.0 | 893.0 | 1,025.0 | 510.0 | 528.0 | 450.4 | 399.2 | 353.9 | 313.7 | 278.0 |
| Inventories, % | 15.79 | 13.43 | 13.6 | 15.22 | 15.22 | 14.65 | 14.65 | 14.65 | 14.65 | 14.65 |
| Accounts Payable | 1,153.0 | 1,016.0 | 1,257.0 | 501.0 | 580.0 | 490.6 | 434.9 | 385.5 | 341.7 | 302.8 |
| Accounts Payable, % | 16.17 | 15.28 | 16.68 | 14.96 | 16.72 | 15.96 | 15.96 | 15.96 | 15.96 | 15.96 |
| Capital Expenditure | -290.0 | -236.0 | -298.0 | -95.0 | -123.0 | -110.4 | -97.8 | -86.7 | -76.9 | -68.1 |
| Capital Expenditure, % | -4.07 | -3.55 | -3.95 | -2.84 | -3.55 | -3.59 | -3.59 | -3.59 | -3.59 | -3.59 |
| Tax Rate, % | 53.77 | 53.77 | 53.77 | 53.77 | 53.77 | 53.77 | 53.77 | 53.77 | 53.77 | 53.77 |
| EBITAT | -400.3 | -384.0 | -199.3 | 7,133.0 | -2.3 | -79.7 | -70.6 | -62.6 | -55.5 | -49.2 |
| Depreciation | ||||||||||
| Changes in Account Receivables | ||||||||||
| Changes in Inventories | ||||||||||
| Changes in Accounts Payable | ||||||||||
| Capital Expenditure | ||||||||||
| UFCF | -1,174.3 | 796.0 | -816.3 | 8,569.0 | -70.3 | 393.1 | 200.3 | 177.5 | 157.3 | 139.5 |
| WACC, % | 7.83 | 7.8 | 7.91 | 8.09 | 7.54 | 7.83 | 7.83 | 7.83 | 7.83 | 7.83 |
| PV UFCF | ||||||||||
| SUM PV UFCF | 890.4 | |||||||||
| Long Term Growth Rate, % | 4.00 | |||||||||
| Free cash flow (T + 1) | 145 | |||||||||
| Terminal Value | 3,785 | |||||||||
| Present Terminal Value | 2,596 | |||||||||
| Enterprise Value | 3,486 | |||||||||
| Net Debt | 1,558 | |||||||||
| Equity Value | 1,928 | |||||||||
| Diluted Shares Outstanding, MM | 1,307 | |||||||||
| Equity Value Per Share | 147.52 |
ما ستتلقاه
- بيانات MROL المالية الحقيقية: الوصول إلى كل من الشخصيات التاريخية والمتوقعة للتقييم الدقيق.
- مدخلات قابلة للتخصيص: اضبط WACC ومعدلات الضرائب ونمو الإيرادات والاستثمارات الرأسمالية حسب الحاجة.
- الحسابات الآلية: يتم حساب القيمة الجوهرية و NPV في الوقت الفعلي.
- تحليل السيناريو: استكشاف السيناريوهات المختلفة لتقييم الأداء المستقبلي لـ Melrose Industries.
- تصميم سهل الاستخدام: مصنوع للمهنيين مع بقاء ودودين للقادمين الجدد.
الميزات الرئيسية
- المدخلات المالية القابلة للتخصيص: تعديل المعايير الأساسية مثل نمو الإيرادات، ونسب الأرباح قبل الفوائد والضرائب والاستهلاك وإطفاء الدين، والنفقات الرأسمالية.
- التقييم الفوري لـ DCF: يحسب تلقائيًا القيمة الجوهرية و NPV والمقاييس المالية الإضافية.
- نتائج دقيقة للغاية: تستفيد من البيانات المالية الواقعية لشركة Melrose Industries PLC (MROL) للحصول على نتائج تقييم دقيقة.
- تحليل السيناريو المبسط: تقييم الافتراضات المختلفة دون عناء وتقييم التأثير على النتائج.
- معزز الكفاءة: قم بتبسيط عمليتك من خلال إلغاء الحاجة إلى إنشاء نموذج تقييم معقد.
كيف تعمل
- 1. الوصول إلى القالب: قم بتنزيل ملف Excel وفتحه يضم بيانات Melrose Industries PLC المسبقة.
- 2. تعديل الافتراضات: ضبط المدخلات الأساسية مثل معدلات النمو ، WACC ، والنفقات الرأسمالية.
- 3. نتائج العرض في الوقت الفعلي: يقوم نموذج DCF تلقائيًا بحساب القيمة الجوهرية و NPV.
- 4. استكشاف السيناريوهات: تقييم التنبؤات المختلفة لدراسة إمكانيات التقييم المختلفة.
- 5. الحاضر مع ضمان: تقديم رؤى تقييم شاملة لإبلاغ قراراتك بثقة.
لماذا اختر حاسبة Melrose Industries PLC (MROL) ؟
- توفير الوقت: تخطي متاعب بناء نموذج DCF من الألف إلى الياء - إنه جاهز للانطلاق!
- تحسين الدقة: والوصول إلى بيانات وصيغ مالية يمكن الاعتماد عليها يقلل من أخطاء التقييم.
- قابل للتخصيص تمامًا: اضبط النموذج ليتوافق مع افتراضاتك وتوقعاتك المحددة.
- سهل الاستخدام: فالخرائط والنواتج البديهية تبسط تحليل النتائج.
- أيد الخبراء: صُنع للمهنيين الذين يعطون الأولوية للدقة وسهولة الاستخدام.
من يمكنه الاستفادة من هذا المنتج؟
- المستثمرون الأفراد: اكتساب رؤى لاتخاذ قرارات استراتيجية فيما يتعلق باستثماراتهم في Melrose Industries PLC (MROL).
- المحللون الماليون: تعزيز دقة التقييم مع نماذج مالية شاملة خصيصًا لـ Melrose Industries PLC (MROL).
- الاستشاريون: تزويد العملاء بتقييمات تقييم دقيقة لـ Melrose Industries PLC (MROL) بكفاءة.
- أصحاب الأعمال: تعلم من استراتيجيات تقييم الشركات الناجحة مثل Melrose Industries PLC (MROL) لتحسين نهج عملك الخاص.
- طلاب التمويل: الحصول على مهارات التقييم العملية باستخدام البيانات في الوقت الفعلي وأمثلة من Melrose Industries PLC (MROL).
محتويات القالب
- نموذج DCF المليء مسبقًا: تم التحميل مسبقًا للبيانات المالية لـ Melrose Industries PLC للتحليل الفوري.
- حاسبة WACC: حسابات شاملة لمتوسط تكلفة رأس المال المرجح.
- النسب المالية: تقييم ربحية Melrose Industries PLC ، والرافعة المالية ، والكفاءة التشغيلية.
- مدخلات قابلة للتحرير: تعديل الافتراضات مثل معدلات النمو والهوامش والنفقات الرأسمالية لتناسب سيناريوهاتك.
- البيانات المالية: الوصول إلى التقارير السنوية والفصلية للتحليل الشامل.
- لوحة القيادة التفاعلية: تصور دون عناء مقاييس التقييم الرئيسية والنتائج.
Disclaimer
All information, articles, and product details provided on this website are for general informational and educational purposes only. We do not claim any ownership over, nor do we intend to infringe upon, any trademarks, copyrights, logos, brand names, or other intellectual property mentioned or depicted on this site. Such intellectual property remains the property of its respective owners, and any references here are made solely for identification or informational purposes, without implying any affiliation, endorsement, or partnership.
We make no representations or warranties, express or implied, regarding the accuracy, completeness, or suitability of any content or products presented. Nothing on this website should be construed as legal, tax, investment, financial, medical, or other professional advice. In addition, no part of this site—including articles or product references—constitutes a solicitation, recommendation, endorsement, advertisement, or offer to buy or sell any securities, franchises, or other financial instruments, particularly in jurisdictions where such activity would be unlawful.
All content is of a general nature and may not address the specific circumstances of any individual or entity. It is not a substitute for professional advice or services. Any actions you take based on the information provided here are strictly at your own risk. You accept full responsibility for any decisions or outcomes arising from your use of this website and agree to release us from any liability in connection with your use of, or reliance upon, the content or products found herein.