
|
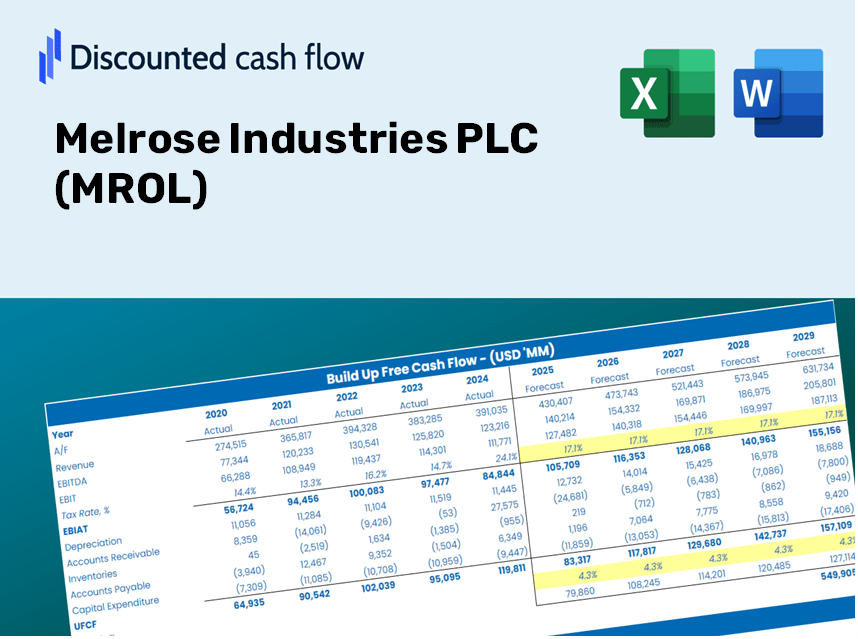
Valoración de DCF de Melrose Industries PLC (MRO.L) |
Completamente Editable: Adáptelo A Sus Necesidades En Excel O Sheets
Diseño Profesional: Plantillas Confiables Y Estándares De La Industria
Predeterminadas Para Un Uso Rápido Y Eficiente
Compatible con MAC / PC, completamente desbloqueado
No Se Necesita Experiencia; Fáciles De Seguir
Melrose Industries PLC (MRO.L) Bundle
¡Obtenga información sobre su análisis de valoración de Melrose Industries PLC (MROL) utilizando nuestra sofisticada calculadora DCF! Prelabastado con datos de MROL precisos, esta plantilla de Excel le permite ajustar los pronósticos y supuestos para determinar con precisión el valor intrínseco de Melrose Industries PLC.
Discounted Cash Flow (DCF) - (USD MM)
| Year | AY1 2020 |
AY2 2021 |
AY3 2022 |
AY4 2023 |
AY5 2024 |
FY1 2025 |
FY2 2026 |
FY3 2027 |
FY4 2028 |
FY5 2029 |
|---|---|---|---|---|---|---|---|---|---|---|
| Revenue | 7,132.0 | 6,650.0 | 7,537.0 | 3,350.0 | 3,468.0 | 3,073.9 | 2,724.7 | 2,415.1 | 2,140.7 | 1,897.4 |
| Revenue Growth, % | 0 | -6.76 | 13.34 | -55.55 | 3.52 | -11.36 | -11.36 | -11.36 | -11.36 | -11.36 |
| EBITDA | 554.0 | 324.0 | 146.0 | 385.0 | 392.0 | 229.8 | 203.7 | 180.5 | 160.0 | 141.8 |
| EBITDA, % | 7.77 | 4.87 | 1.94 | 11.49 | 11.3 | 7.47 | 7.47 | 7.47 | 7.47 | 7.47 |
| Depreciation | 1,093.0 | 860.0 | 389.0 | 329.0 | 397.0 | 336.2 | 298.0 | 264.1 | 234.1 | 207.5 |
| Depreciation, % | 15.33 | 12.93 | 5.16 | 9.82 | 11.45 | 10.94 | 10.94 | 10.94 | 10.94 | 10.94 |
| EBIT | -539.0 | -536.0 | -243.0 | 56.0 | -5.0 | -106.4 | -94.4 | -83.6 | -74.1 | -65.7 |
| EBIT, % | -7.56 | -8.06 | -3.22 | 1.67 | -0.14418 | -3.46 | -3.46 | -3.46 | -3.46 | -3.46 |
| Total Cash | 311.0 | 473.0 | 355.0 | 58.0 | 88.0 | 125.7 | 111.5 | 98.8 | 87.6 | 77.6 |
| Total Cash, percent | .0 | .0 | .0 | .0 | .0 | .0 | .0 | .0 | .0 | .0 |
| Account Receivables | 1,604.0 | 1,144.0 | 1,961.0 | 518.0 | 921.0 | 662.3 | 587.1 | 520.4 | 461.2 | 408.8 |
| Account Receivables, % | 22.49 | 17.2 | 26.02 | 15.46 | 26.56 | 21.55 | 21.55 | 21.55 | 21.55 | 21.55 |
| Inventories | 1,126.0 | 893.0 | 1,025.0 | 510.0 | 528.0 | 450.4 | 399.2 | 353.9 | 313.7 | 278.0 |
| Inventories, % | 15.79 | 13.43 | 13.6 | 15.22 | 15.22 | 14.65 | 14.65 | 14.65 | 14.65 | 14.65 |
| Accounts Payable | 1,153.0 | 1,016.0 | 1,257.0 | 501.0 | 580.0 | 490.6 | 434.9 | 385.5 | 341.7 | 302.8 |
| Accounts Payable, % | 16.17 | 15.28 | 16.68 | 14.96 | 16.72 | 15.96 | 15.96 | 15.96 | 15.96 | 15.96 |
| Capital Expenditure | -290.0 | -236.0 | -298.0 | -95.0 | -123.0 | -110.4 | -97.8 | -86.7 | -76.9 | -68.1 |
| Capital Expenditure, % | -4.07 | -3.55 | -3.95 | -2.84 | -3.55 | -3.59 | -3.59 | -3.59 | -3.59 | -3.59 |
| Tax Rate, % | 53.77 | 53.77 | 53.77 | 53.77 | 53.77 | 53.77 | 53.77 | 53.77 | 53.77 | 53.77 |
| EBITAT | -400.3 | -384.0 | -199.3 | 7,133.0 | -2.3 | -79.7 | -70.6 | -62.6 | -55.5 | -49.2 |
| Depreciation | ||||||||||
| Changes in Account Receivables | ||||||||||
| Changes in Inventories | ||||||||||
| Changes in Accounts Payable | ||||||||||
| Capital Expenditure | ||||||||||
| UFCF | -1,174.3 | 796.0 | -816.3 | 8,569.0 | -70.3 | 393.1 | 200.3 | 177.5 | 157.3 | 139.5 |
| WACC, % | 8.26 | 8.24 | 8.34 | 8.53 | 7.98 | 8.27 | 8.27 | 8.27 | 8.27 | 8.27 |
| PV UFCF | ||||||||||
| SUM PV UFCF | 882.0 | |||||||||
| Long Term Growth Rate, % | 4.00 | |||||||||
| Free cash flow (T + 1) | 145 | |||||||||
| Terminal Value | 3,397 | |||||||||
| Present Terminal Value | 2,283 | |||||||||
| Enterprise Value | 3,165 | |||||||||
| Net Debt | 1,558 | |||||||||
| Equity Value | 1,607 | |||||||||
| Diluted Shares Outstanding, MM | 1,307 | |||||||||
| Equity Value Per Share | 122.97 |
What You'll Receive
- Genuine MROL Financial Data: Access both historical and projected figures for precise valuation.
- Customizable Inputs: Adjust WACC, tax rates, revenue growth, and capital investments as needed.
- Automated Calculations: Intrinsic value and NPV are computed in real-time.
- Scenario Analysis: Explore various scenarios to assess Melrose Industries' future performance.
- User-Friendly Design: Crafted for professionals while remaining approachable for newcomers.
Key Features
- Customizable Financial Inputs: Adjust essential parameters such as revenue growth, EBITDA percentages, and capital expenditures.
- Instant DCF Valuation: Automatically computes intrinsic value, NPV, and additional financial metrics.
- Highly Accurate Results: Leverages Melrose Industries PLC's (MROL) real-world financial data for precise valuation results.
- Simplified Scenario Analysis: Effortlessly evaluate various assumptions and assess the impact on outcomes.
- Efficiency Booster: Streamline your process by eliminating the need for complex valuation model creation.
How It Operates
- 1. Access the Template: Download and open the Excel file featuring Melrose Industries PLC’s preloaded data.
- 2. Modify Assumptions: Adjust essential inputs such as growth rates, WACC, and capital expenditures.
- 3. View Results in Real-Time: The DCF model automatically computes intrinsic value and NPV.
- 4. Explore Scenarios: Evaluate various forecasts to examine different valuation possibilities.
- 5. Present with Assurance: Deliver comprehensive valuation insights to inform your decisions confidently.
Why Opt for the Melrose Industries PLC (MROL) Calculator?
- Time-Saving: Skip the hassle of building a DCF model from the ground up – it's ready to go!
- Enhanced Accuracy: Access to dependable financial data and formulas minimizes valuation errors.
- Completely Customizable: Adjust the model to align with your specific assumptions and forecasts.
- User-Friendly: Intuitive charts and outputs simplify analysis of the results.
- Expert Endorsed: Crafted for professionals who prioritize both accuracy and ease of use.
Who Can Benefit from This Product?
- Individual Investors: Gain insights to make strategic decisions regarding their investments in Melrose Industries PLC (MROL).
- Financial Analysts: Enhance valuation accuracy with comprehensive financial models specifically for Melrose Industries PLC (MROL).
- Consultants: Provide clients with precise valuation assessments of Melrose Industries PLC (MROL) efficiently.
- Business Owners: Learn from the valuation strategies of successful companies like Melrose Industries PLC (MROL) to refine your own business approach.
- Finance Students: Acquire practical valuation skills using real-time data and examples from Melrose Industries PLC (MROL).
Contents of the Template
- Pre-Filled DCF Model: Melrose Industries PLC’s financial data preloaded for immediate analysis.
- WACC Calculator: Comprehensive calculations for the Weighted Average Cost of Capital.
- Financial Ratios: Assess Melrose Industries PLC’s profitability, leverage, and operational efficiency.
- Editable Inputs: Modify assumptions such as growth rates, margins, and capital expenditures to suit your scenarios.
- Financial Statements: Access annual and quarterly reports for thorough analysis.
- Interactive Dashboard: Effortlessly visualize key valuation metrics and outcomes.
Disclaimer
All information, articles, and product details provided on this website are for general informational and educational purposes only. We do not claim any ownership over, nor do we intend to infringe upon, any trademarks, copyrights, logos, brand names, or other intellectual property mentioned or depicted on this site. Such intellectual property remains the property of its respective owners, and any references here are made solely for identification or informational purposes, without implying any affiliation, endorsement, or partnership.
We make no representations or warranties, express or implied, regarding the accuracy, completeness, or suitability of any content or products presented. Nothing on this website should be construed as legal, tax, investment, financial, medical, or other professional advice. In addition, no part of this site—including articles or product references—constitutes a solicitation, recommendation, endorsement, advertisement, or offer to buy or sell any securities, franchises, or other financial instruments, particularly in jurisdictions where such activity would be unlawful.
All content is of a general nature and may not address the specific circumstances of any individual or entity. It is not a substitute for professional advice or services. Any actions you take based on the information provided here are strictly at your own risk. You accept full responsibility for any decisions or outcomes arising from your use of this website and agree to release us from any liability in connection with your use of, or reliance upon, the content or products found herein.