
|
Northeast Community Bancorp ، Inc. (NECB) DCF تقييم |
Fully Editable: Tailor To Your Needs In Excel Or Sheets
Professional Design: Trusted, Industry-Standard Templates
Investor-Approved Valuation Models
MAC/PC Compatible, Fully Unlocked
No Expertise Is Needed; Easy To Follow
Northeast Community Bancorp, Inc. (NECB) Bundle
تبسيط تحليلك وتحسين الدقة مع حاسبة (NECB) DCF! باستخدام بيانات حقيقية من Northeast Community Bancorp ، Inc. والافتراضات القابلة للتخصيص ، فإن هذه الأداة تمكنك من التنبؤ وتحليل وتقييم (NECB) مثل المستثمر المحنك.
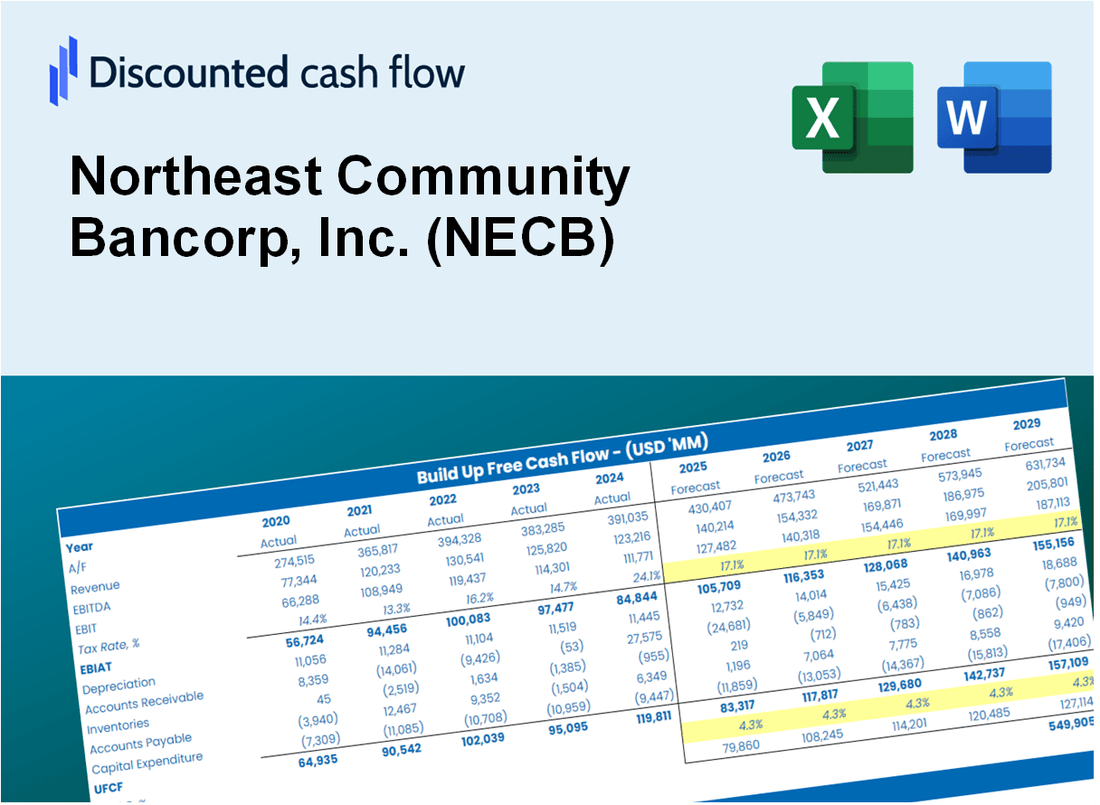
Discounted Cash Flow (DCF) - (USD MM)
| Year | AY1 2020 |
AY2 2021 |
AY3 2022 |
AY4 2023 |
AY5 2024 |
FY1 2025 |
FY2 2026 |
FY3 2027 |
FY4 2028 |
FY5 2029 |
|---|---|---|---|---|---|---|---|---|---|---|
| Revenue | 51.6 | 50.8 | 73.6 | 133.7 | 159.8 | 217.7 | 296.4 | 403.6 | 549.6 | 748.4 |
| Revenue Growth, % | 0 | -1.55 | 45 | 81.7 | 19.55 | 36.17 | 36.17 | 36.17 | 36.17 | 36.17 |
| EBITDA | 16.7 | 16.7 | 35.7 | 66.0 | 67.0 | 89.2 | 121.5 | 165.4 | 225.3 | 306.8 |
| EBITDA, % | 32.35 | 32.89 | 48.48 | 49.33 | 41.89 | 40.99 | 40.99 | 40.99 | 40.99 | 40.99 |
| Depreciation | 1.1 | 1.1 | 1.2 | 1.2 | 1.2 | 3.3 | 4.5 | 6.1 | 8.4 | 11.4 |
| Depreciation, % | 2.07 | 2.2 | 1.69 | 0.91172 | 0.74197 | 1.52 | 1.52 | 1.52 | 1.52 | 1.52 |
| EBIT | 15.6 | 15.6 | 34.4 | 64.7 | 65.8 | 85.9 | 117.0 | 159.3 | 216.9 | 295.4 |
| EBIT, % | 30.28 | 30.69 | 46.79 | 48.42 | 41.15 | 39.47 | 39.47 | 39.47 | 39.47 | 39.47 |
| Total Cash | 69.3 | 152.4 | 95.4 | 68.7 | 78.4 | 174.3 | 237.3 | 323.2 | 440.1 | 599.3 |
| Total Cash, percent | .0 | .0 | .0 | .0 | .0 | .0 | .0 | .0 | .0 | .0 |
| Account Receivables | 3.8 | 4.3 | 8.6 | 12.3 | 13.5 | 19.7 | 26.8 | 36.5 | 49.7 | 67.7 |
| Account Receivables, % | 7.45 | 8.44 | 11.68 | 9.21 | 8.43 | 9.04 | 9.04 | 9.04 | 9.04 | 9.04 |
| Inventories | .0 | .0 | .0 | .0 | .0 | .0 | .0 | .0 | .0 | .0 |
| Inventories, % | 0 | 0 | 0 | 0 | 0 | 0 | 0 | 0 | 0 | 0 |
| Accounts Payable | .0 | .0 | 14.8 | .0 | .0 | 8.7 | 11.9 | 16.2 | 22.0 | 30.0 |
| Accounts Payable, % | 0 | 0 | 20.05 | 0 | 0 | 4.01 | 4.01 | 4.01 | 4.01 | 4.01 |
| Capital Expenditure | -1.3 | -6.5 | -3.3 | -.6 | -.5 | -8.9 | -12.1 | -16.5 | -22.5 | -30.6 |
| Capital Expenditure, % | -2.45 | -12.71 | -4.49 | -0.4682 | -0.32344 | -4.09 | -4.09 | -4.09 | -4.09 | -4.09 |
| Tax Rate, % | 28.43 | 28.43 | 28.43 | 28.43 | 28.43 | 28.43 | 28.43 | 28.43 | 28.43 | 28.43 |
| EBITAT | 12.3 | 11.9 | 24.8 | 46.3 | 47.1 | 63.7 | 86.7 | 118.1 | 160.8 | 218.9 |
| Depreciation | ||||||||||
| Changes in Account Receivables | ||||||||||
| Changes in Inventories | ||||||||||
| Changes in Accounts Payable | ||||||||||
| Capital Expenditure | ||||||||||
| UFCF | 8.3 | 6.1 | 33.2 | 28.4 | 46.6 | 60.6 | 75.1 | 102.3 | 139.3 | 189.7 |
| WACC, % | 23.02 | 22.47 | 21.56 | 21.41 | 21.43 | 21.98 | 21.98 | 21.98 | 21.98 | 21.98 |
| PV UFCF | ||||||||||
| SUM PV UFCF | 289.8 | |||||||||
| Long Term Growth Rate, % | 2.00 | |||||||||
| Free cash flow (T + 1) | 194 | |||||||||
| Terminal Value | 969 | |||||||||
| Present Terminal Value | 359 | |||||||||
| Enterprise Value | 649 | |||||||||
| Net Debt | -74 | |||||||||
| Equity Value | 722 | |||||||||
| Diluted Shares Outstanding, MM | 13 | |||||||||
| Equity Value Per Share | 54.06 |
What You Will Get
- Real NECB Data: Preloaded financials – from revenue to EBIT – based on actual and projected figures for Northeast Community Bancorp, Inc. (NECB).
- Full Customization: Adjust all critical parameters (yellow cells) like WACC, growth %, and tax rates tailored for NECB.
- Instant Valuation Updates: Automatic recalculations to analyze the impact of changes on Northeast Community Bancorp, Inc.'s (NECB) fair value.
- Versatile Excel Template: Designed for quick edits, scenario testing, and detailed projections specific to NECB.
- Time-Saving and Accurate: Skip building models from scratch while ensuring precision and flexibility for Northeast Community Bancorp, Inc. (NECB).
Key Features
- 🔍 Real-Life NECB Financials: Pre-filled historical and projected data for Northeast Community Bancorp, Inc. (NECB).
- ✏️ Fully Customizable Inputs: Adjust all critical parameters (yellow cells) like WACC, growth %, and tax rates.
- 📊 Professional DCF Valuation: Built-in formulas calculate Northeast Community Bancorp’s intrinsic value using the Discounted Cash Flow method.
- ⚡ Instant Results: Visualize Northeast Community Bancorp’s valuation instantly after making changes.
- Scenario Analysis: Test and compare outcomes for various financial assumptions side-by-side.
How It Works
- 1. Open the Template: Download and open the Excel file featuring Northeast Community Bancorp, Inc.'s (NECB) preloaded data.
- 2. Edit Assumptions: Modify essential inputs such as growth rates, WACC, and capital expenditures.
- 3. View Results Instantly: The DCF model automatically computes intrinsic value and NPV based on your inputs.
- 4. Test Scenarios: Evaluate various forecasts to explore different valuation scenarios.
- 5. Use with Confidence: Present expert valuation insights to enhance your decision-making process.
Why Choose the NECB Financial Calculator?
- Accuracy: Utilizes real Northeast Community Bancorp, Inc. (NECB) financial data for precise calculations.
- Flexibility: Allows users to easily test and adjust inputs as needed.
- Time-Saving: Avoid the complexities of constructing a financial model from the ground up.
- Professional-Grade: Crafted with attention to detail suitable for CFO-level analysis and efficiency.
- User-Friendly: Intuitive design makes it accessible for users without extensive financial modeling skills.
Who Should Use Northeast Community Bancorp, Inc. (NECB)?
- Investors: Gain insights and make informed decisions with a reliable banking partner.
- Financial Analysts: Utilize comprehensive financial reports to enhance your market assessments.
- Consultants: Leverage our resources to support client strategies and financial planning.
- Community Members: Access local banking services that cater to your financial needs.
- Students and Educators: Explore case studies and real-world applications in community banking.
What the Template Contains
- Pre-Filled Data: Contains Northeast Community Bancorp, Inc.'s (NECB) historical financials and projections.
- Discounted Cash Flow Model: An editable DCF valuation model with automatic calculations.
- Weighted Average Cost of Capital (WACC): A dedicated sheet for calculating WACC based on customized inputs.
- Key Financial Ratios: Evaluate NECB's profitability, efficiency, and leverage.
- Customizable Inputs: Easily edit revenue growth, margins, and tax rates.
- Clear Dashboard: Visualizations and tables summarizing key valuation outcomes.
Disclaimer
All information, articles, and product details provided on this website are for general informational and educational purposes only. We do not claim any ownership over, nor do we intend to infringe upon, any trademarks, copyrights, logos, brand names, or other intellectual property mentioned or depicted on this site. Such intellectual property remains the property of its respective owners, and any references here are made solely for identification or informational purposes, without implying any affiliation, endorsement, or partnership.
We make no representations or warranties, express or implied, regarding the accuracy, completeness, or suitability of any content or products presented. Nothing on this website should be construed as legal, tax, investment, financial, medical, or other professional advice. In addition, no part of this site—including articles or product references—constitutes a solicitation, recommendation, endorsement, advertisement, or offer to buy or sell any securities, franchises, or other financial instruments, particularly in jurisdictions where such activity would be unlawful.
All content is of a general nature and may not address the specific circumstances of any individual or entity. It is not a substitute for professional advice or services. Any actions you take based on the information provided here are strictly at your own risk. You accept full responsibility for any decisions or outcomes arising from your use of this website and agree to release us from any liability in connection with your use of, or reliance upon, the content or products found herein.