
|
Northfield Bancorp ، Inc. (Staten Island ، NY) (NFBK) DCF تقييم |
Fully Editable: Tailor To Your Needs In Excel Or Sheets
Professional Design: Trusted, Industry-Standard Templates
Investor-Approved Valuation Models
MAC/PC Compatible, Fully Unlocked
No Expertise Is Needed; Easy To Follow
Northfield Bancorp, Inc. (Staten Island, NY) (NFBK) Bundle
هل تبحث عن تقييم القيمة الجوهرية لشركة Northfield Bancorp، Inc. ؟ تدمج حاسبة DCF (NFBK) الخاصة بنا بيانات العالم الحقيقي مع ميزات التخصيص الشاملة، مما يتيح لك تحسين توقعاتك وتعزيز استراتيجيات الاستثمار الخاصة بك.
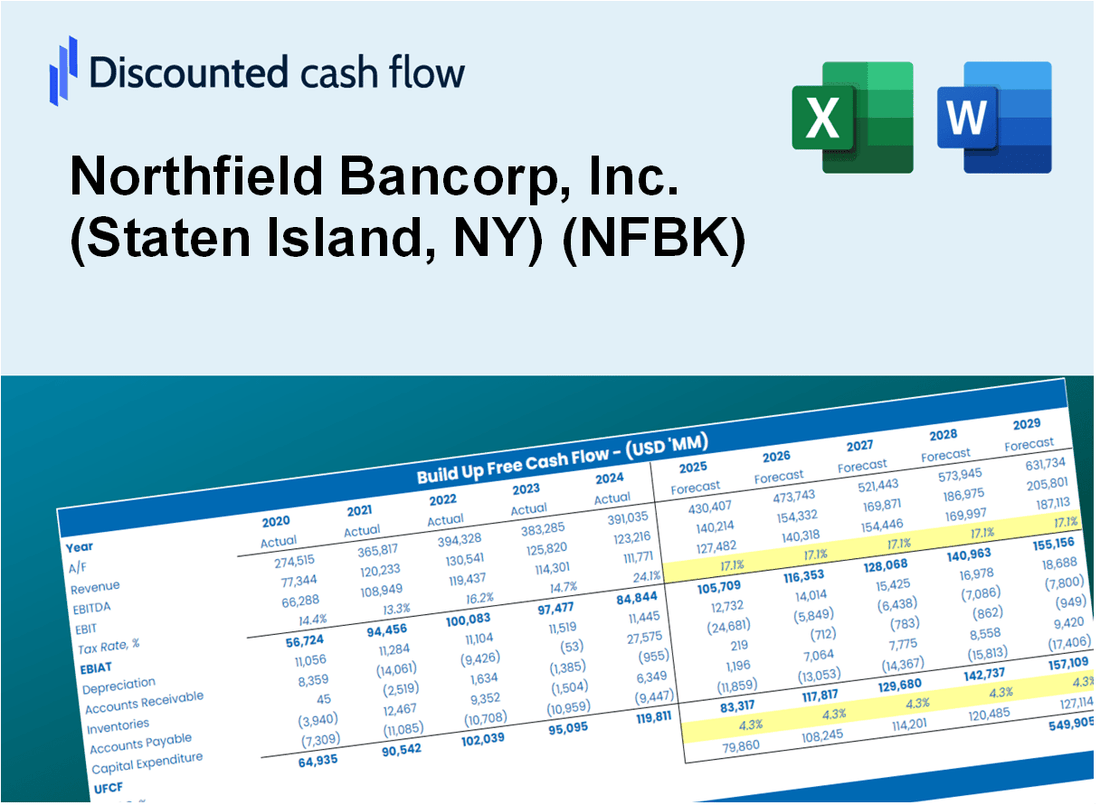
Discounted Cash Flow (DCF) - (USD MM)
| Year | AY1 2020 |
AY2 2021 |
AY3 2022 |
AY4 2023 |
AY5 2024 |
FY1 2025 |
FY2 2026 |
FY3 2027 |
FY4 2028 |
FY5 2029 |
|---|---|---|---|---|---|---|---|---|---|---|
| Revenue | 179.6 | 186.8 | 187.7 | 220.7 | 251.3 | 273.9 | 298.5 | 325.3 | 354.6 | 386.4 |
| Revenue Growth, % | 0 | 3.97 | 0.49263 | 17.59 | 13.88 | 8.99 | 8.99 | 8.99 | 8.99 | 8.99 |
| EBITDA | 58.7 | 105.6 | 93.3 | 60.3 | 48.8 | 101.7 | 110.9 | 120.8 | 131.7 | 143.5 |
| EBITDA, % | 32.69 | 56.55 | 49.72 | 27.32 | 19.42 | 37.14 | 37.14 | 37.14 | 37.14 | 37.14 |
| Depreciation | 8.7 | 8.5 | 8.4 | 8.5 | 8.3 | 11.5 | 12.6 | 13.7 | 14.9 | 16.3 |
| Depreciation, % | 4.84 | 4.54 | 4.5 | 3.87 | 3.3 | 4.21 | 4.21 | 4.21 | 4.21 | 4.21 |
| EBIT | 50.0 | 97.1 | 84.9 | 51.8 | 40.5 | 90.2 | 98.3 | 107.1 | 116.8 | 127.3 |
| EBIT, % | 27.85 | 52.01 | 45.22 | 23.45 | 16.11 | 32.93 | 32.93 | 32.93 | 32.93 | 32.93 |
| Total Cash | 1,352.3 | 1,299.3 | 998.0 | 1,025.0 | 1,268.6 | 273.9 | 298.5 | 325.3 | 354.6 | 386.4 |
| Total Cash, percent | .0 | .0 | .0 | .0 | .0 | .0 | .0 | .0 | .0 | .0 |
| Account Receivables | 14.7 | 14.6 | 17.4 | 18.5 | 19.1 | 22.6 | 24.6 | 26.8 | 29.2 | 31.9 |
| Account Receivables, % | 8.18 | 7.8 | 9.29 | 8.38 | 7.59 | 8.25 | 8.25 | 8.25 | 8.25 | 8.25 |
| Inventories | .0 | .0 | .0 | .0 | .0 | .0 | .0 | .0 | .0 | .0 |
| Inventories, % | 0 | 0 | 0 | 0 | 0 | 0 | 0 | 0 | 0 | 0 |
| Accounts Payable | .0 | .0 | .0 | .0 | .0 | .0 | .0 | .0 | .0 | .0 |
| Accounts Payable, % | 0 | 0 | 0 | 0 | 0 | 0 | 0 | 0 | 0 | 0 |
| Capital Expenditure | -3.1 | -1.6 | -2.6 | -3.6 | -1.2 | -3.3 | -3.6 | -3.9 | -4.3 | -4.7 |
| Capital Expenditure, % | -1.7 | -0.8771 | -1.36 | -1.63 | -0.45916 | -1.21 | -1.21 | -1.21 | -1.21 | -1.21 |
| Tax Rate, % | 26.06 | 26.06 | 26.06 | 26.06 | 26.06 | 26.06 | 26.06 | 26.06 | 26.06 | 26.06 |
| EBITAT | 37.0 | 70.7 | 61.1 | 37.7 | 29.9 | 65.9 | 71.8 | 78.3 | 85.3 | 93.0 |
| Depreciation | ||||||||||
| Changes in Account Receivables | ||||||||||
| Changes in Inventories | ||||||||||
| Changes in Accounts Payable | ||||||||||
| Capital Expenditure | ||||||||||
| UFCF | 27.9 | 77.6 | 64.2 | 41.5 | 36.5 | 70.6 | 78.8 | 85.9 | 93.6 | 102.0 |
| WACC, % | 10.46 | 10.34 | 10.26 | 10.34 | 10.46 | 10.37 | 10.37 | 10.37 | 10.37 | 10.37 |
| PV UFCF | ||||||||||
| SUM PV UFCF | 317.8 | |||||||||
| Long Term Growth Rate, % | 2.00 | |||||||||
| Free cash flow (T + 1) | 104 | |||||||||
| Terminal Value | 1,243 | |||||||||
| Present Terminal Value | 759 | |||||||||
| Enterprise Value | 1,077 | |||||||||
| Net Debt | 592 | |||||||||
| Equity Value | 484 | |||||||||
| Diluted Shares Outstanding, MM | 42 | |||||||||
| Equity Value Per Share | 11.63 |
What You Will Receive
- Adjustable Forecast Inputs: Effortlessly modify assumptions (growth %, margins, WACC) to explore various scenarios.
- Real-World Data: Northfield Bancorp's financial data pre-loaded to kickstart your analysis.
- Automated DCF Outputs: The template computes Net Present Value (NPV) and intrinsic value automatically.
- Customizable and Professional Design: A refined Excel model that caters to your valuation requirements.
- Designed for Analysts and Investors: Perfect for evaluating projections, confirming strategies, and enhancing efficiency.
Key Features
- Customizable Financial Inputs: Adjust essential parameters such as loan growth, interest income, and operating expenses.
- Instant DCF Valuation: Quickly computes intrinsic value, NPV, and other financial metrics.
- High Precision Accuracy: Leverages Northfield Bancorp’s actual financial data for dependable valuation results.
- Effortless Scenario Testing: Easily explore various assumptions and analyze different outcomes.
- Efficiency Booster: Avoid the hassle of constructing intricate valuation models from the ground up.
How It Works
- Step 1: Download the prebuilt Excel template featuring Northfield Bancorp, Inc. (NFBK) data.
- Step 2: Review the pre-filled sheets to familiarize yourself with the key financial metrics.
- Step 3: Modify forecasts and assumptions in the editable yellow cells (WACC, growth, margins).
- Step 4: Instantly see the recalculated results, including Northfield Bancorp, Inc.'s intrinsic value.
- Step 5: Make well-informed investment decisions or create reports based on the outputs.
Why Choose This Calculator?
- Accurate Data: Real Northfield Bancorp, Inc. (Staten Island, NY) (NFBK) financials ensure reliable valuation results.
- Customizable: Adjust key parameters like growth rates, WACC, and tax rates to match your projections.
- Time-Saving: Pre-built calculations eliminate the need to start from scratch.
- Professional-Grade Tool: Designed for investors, analysts, and consultants.
- User-Friendly: Intuitive layout and step-by-step instructions make it easy for all users.
Who Should Use This Product?
- Investors: Assess Northfield Bancorp’s valuation before making stock transactions.
- CFOs and Financial Analysts: Enhance valuation methodologies and evaluate financial forecasts.
- Startup Founders: Understand how established financial institutions like Northfield Bancorp are appraised.
- Consultants: Provide expert valuation analyses and reports for clients.
- Students and Educators: Utilize real-time data to learn and teach valuation strategies.
What the Template Contains
- Operating and Balance Sheet Data: Pre-filled Northfield Bancorp, Inc. (Staten Island, NY) (NFBK) historical data and forecasts, including revenue, EBITDA, EBIT, and capital expenditures.
- WACC Calculation: A dedicated sheet for Weighted Average Cost of Capital (WACC), featuring parameters like Beta, risk-free rate, and share price.
- DCF Valuation (Unlevered and Levered): Editable Discounted Cash Flow models illustrating intrinsic value with comprehensive calculations.
- Financial Statements: Pre-loaded financial statements (annual and quarterly) to facilitate analysis.
- Key Ratios: Includes profitability, leverage, and efficiency ratios specific to Northfield Bancorp, Inc. (NFBK).
- Dashboard and Charts: Visual summary of valuation outputs and assumptions for easy result analysis.
Disclaimer
All information, articles, and product details provided on this website are for general informational and educational purposes only. We do not claim any ownership over, nor do we intend to infringe upon, any trademarks, copyrights, logos, brand names, or other intellectual property mentioned or depicted on this site. Such intellectual property remains the property of its respective owners, and any references here are made solely for identification or informational purposes, without implying any affiliation, endorsement, or partnership.
We make no representations or warranties, express or implied, regarding the accuracy, completeness, or suitability of any content or products presented. Nothing on this website should be construed as legal, tax, investment, financial, medical, or other professional advice. In addition, no part of this site—including articles or product references—constitutes a solicitation, recommendation, endorsement, advertisement, or offer to buy or sell any securities, franchises, or other financial instruments, particularly in jurisdictions where such activity would be unlawful.
All content is of a general nature and may not address the specific circumstances of any individual or entity. It is not a substitute for professional advice or services. Any actions you take based on the information provided here are strictly at your own risk. You accept full responsibility for any decisions or outcomes arising from your use of this website and agree to release us from any liability in connection with your use of, or reliance upon, the content or products found herein.