
|
Nine Energy Service ، Inc. (تسعة) تقييم DCF |
Fully Editable: Tailor To Your Needs In Excel Or Sheets
Professional Design: Trusted, Industry-Standard Templates
Investor-Approved Valuation Models
MAC/PC Compatible, Fully Unlocked
No Expertise Is Needed; Easy To Follow
Nine Energy Service, Inc. (NINE) Bundle
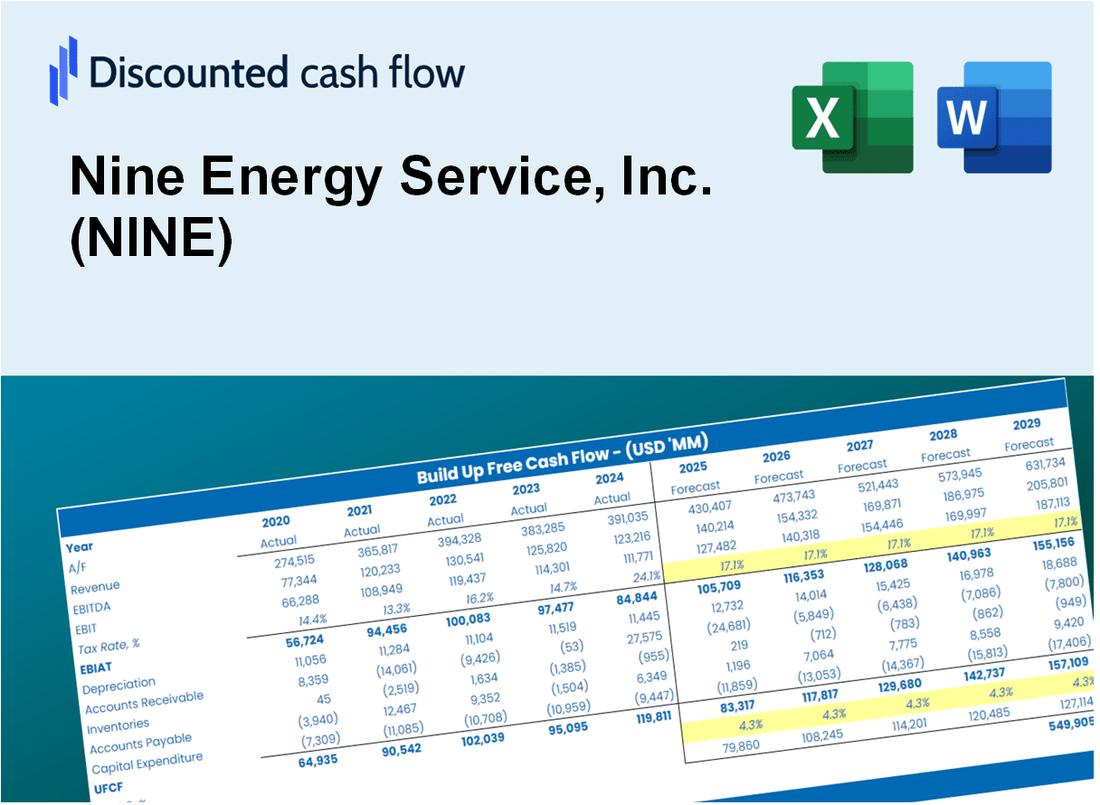
كسب إتقان تحليل التقييم Nine Energy Service ، Inc. (تسعة) مع حاسبة DCF الحديثة لدينا! يتم تحميله مسبقًا ببيانات حقيقية (تسعة) ، يمكّنك هذا القالب Excel من ضبط التنبؤات والافتراضات ، مما يتيح لك حساب القيمة الجوهرية لتسع خدمات الطاقة (تسعة) بدقة.
What You Will Get
- Real Nine Energy Data: Preloaded financials – from revenue to EBIT – based on actual and projected figures.
- Full Customization: Adjust all critical parameters (yellow cells) like WACC, growth %, and tax rates.
- Instant Valuation Updates: Automatic recalculations to analyze the impact of changes on Nine Energy's fair value.
- Versatile Excel Template: Tailored for quick edits, scenario testing, and detailed projections.
- Time-Saving and Accurate: Skip building models from scratch while maintaining precision and flexibility.
Key Features
- Comprehensive Nine Energy Financials: Gain access to precise pre-loaded historical data and future forecasts.
- Adjustable Forecast Assumptions: Modify the yellow-highlighted fields such as WACC, growth rates, and profit margins.
- Real-Time Calculations: Automatic updates for DCF, Net Present Value (NPV), and cash flow assessments.
- Interactive Dashboard: User-friendly charts and summaries to effectively visualize your valuation outcomes.
- Suitable for All Skill Levels: A straightforward, intuitive layout designed for investors, CFOs, and consultants alike.
How It Works
- Download the Template: Gain immediate access to the Excel-based NINE DCF Calculator.
- Input Your Assumptions: Modify the yellow-highlighted cells for growth rates, WACC, margins, and other variables.
- Instant Calculations: The model automatically refreshes Nine Energy Service’s intrinsic value.
- Test Scenarios: Experiment with various assumptions to assess potential valuation impacts.
- Analyze and Decide: Utilize the findings to inform your investment or financial evaluation.
Why Choose This Calculator for Nine Energy Service, Inc. (NINE)?
- All-in-One Solution: Combines DCF, WACC, and financial ratio evaluations for comprehensive analysis.
- Flexible Inputs: Modify the yellow-highlighted fields to explore different financial scenarios.
- In-Depth Analysis: Automatically computes Nine Energy's intrinsic value and Net Present Value.
- Preloaded Information: Access to historical and projected data for reliable starting points.
- High-Quality Standards: Perfect for financial analysts, investors, and business advisors.
Who Should Use Nine Energy Service, Inc. (NINE)?
- Investors: Make informed choices with a comprehensive analysis of energy service market trends.
- Financial Analysts: Streamline your workflow with pre-built financial models tailored for the energy sector.
- Consultants: Easily modify reports and presentations to meet client needs in the energy industry.
- Energy Enthusiasts: Enhance your knowledge of energy services through detailed case studies and insights.
- Educators and Students: Utilize it as an effective resource for learning about energy markets and service operations.
What the Template Contains
- Pre-Filled Data: Contains Nine Energy Service, Inc.'s historical financials and projections.
- Discounted Cash Flow Model: Editable DCF valuation model with automatic computations.
- Weighted Average Cost of Capital (WACC): A dedicated sheet for calculating WACC based on user-defined inputs.
- Key Financial Ratios: Assess Nine Energy Service, Inc.'s profitability, efficiency, and leverage.
- Customizable Inputs: Easily modify revenue growth, profit margins, and tax rates.
- Clear Dashboard: Visuals and tables summarizing essential valuation outcomes.
Disclaimer
All information, articles, and product details provided on this website are for general informational and educational purposes only. We do not claim any ownership over, nor do we intend to infringe upon, any trademarks, copyrights, logos, brand names, or other intellectual property mentioned or depicted on this site. Such intellectual property remains the property of its respective owners, and any references here are made solely for identification or informational purposes, without implying any affiliation, endorsement, or partnership.
We make no representations or warranties, express or implied, regarding the accuracy, completeness, or suitability of any content or products presented. Nothing on this website should be construed as legal, tax, investment, financial, medical, or other professional advice. In addition, no part of this site—including articles or product references—constitutes a solicitation, recommendation, endorsement, advertisement, or offer to buy or sell any securities, franchises, or other financial instruments, particularly in jurisdictions where such activity would be unlawful.
All content is of a general nature and may not address the specific circumstances of any individual or entity. It is not a substitute for professional advice or services. Any actions you take based on the information provided here are strictly at your own risk. You accept full responsibility for any decisions or outcomes arising from your use of this website and agree to release us from any liability in connection with your use of, or reliance upon, the content or products found herein.