
|
Nayax Ltd. (Nyax) تقييم DCF |
Fully Editable: Tailor To Your Needs In Excel Or Sheets
Professional Design: Trusted, Industry-Standard Templates
Investor-Approved Valuation Models
MAC/PC Compatible, Fully Unlocked
No Expertise Is Needed; Easy To Follow
Nayax Ltd. (NYAX) Bundle
تقييم التوقعات المالية لـ Nayax Ltd. كخبير! توفر لك حاسبة NYAX DCF هذه المالية التي تم تحميلها مسبقًا وحرية تعديل نمو الإيرادات ، WACC ، الهوامش ، وغيرها من الافتراضات الحرجة التي تتماشى مع توقعاتك.
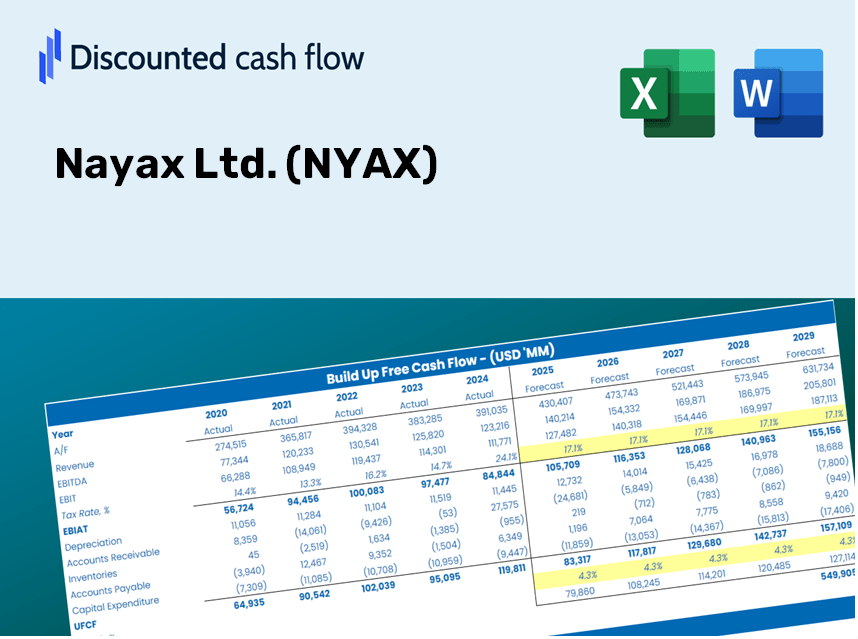
Discounted Cash Flow (DCF) - (USD MM)
| Year | AY1 2020 |
AY2 2021 |
AY3 2022 |
AY4 2023 |
AY5 2024 |
FY1 2025 |
FY2 2026 |
FY3 2027 |
FY4 2028 |
FY5 2029 |
|---|---|---|---|---|---|---|---|---|---|---|
| Revenue | 78.8 | 119.1 | 173.5 | 235.5 | 314.0 | 444.3 | 628.6 | 889.3 | 1,258.2 | 1,780.1 |
| Revenue Growth, % | 0 | 51.22 | 45.65 | 35.72 | 33.34 | 41.48 | 41.48 | 41.48 | 41.48 | 41.48 |
| EBITDA | 1.7 | -15.2 | -26.7 | 2.3 | 23.7 | -15.6 | -22.0 | -31.2 | -44.1 | -62.4 |
| EBITDA, % | 2.13 | -12.8 | -15.39 | 0.99347 | 7.55 | -3.5 | -3.5 | -3.5 | -3.5 | -3.5 |
| Depreciation | 6.3 | 7.5 | 8.6 | 12.7 | 21.4 | 28.0 | 39.6 | 56.0 | 79.2 | 112.1 |
| Depreciation, % | 8.03 | 6.28 | 4.97 | 5.39 | 6.81 | 6.3 | 6.3 | 6.3 | 6.3 | 6.3 |
| EBIT | -4.7 | -22.7 | -35.3 | -10.4 | 2.3 | -43.5 | -61.6 | -87.2 | -123.3 | -174.5 |
| EBIT, % | -5.9 | -19.08 | -20.36 | -4.4 | 0.74105 | -9.8 | -9.8 | -9.8 | -9.8 | -9.8 |
| Total Cash | 8.3 | 87.4 | 34.0 | 39.7 | 92.5 | 133.0 | 188.2 | 266.3 | 376.7 | 533.0 |
| Total Cash, percent | .0 | .0 | .0 | .0 | .0 | .0 | .0 | .0 | .0 | .0 |
| Account Receivables | 13.8 | 19.3 | 27.4 | 83.9 | 100.8 | 104.2 | 147.5 | 208.6 | 295.2 | 417.6 |
| Account Receivables, % | 17.57 | 16.23 | 15.8 | 35.61 | 32.09 | 23.46 | 23.46 | 23.46 | 23.46 | 23.46 |
| Inventories | 5.0 | 7.7 | 23.8 | 20.6 | 19.8 | 37.0 | 52.3 | 74.0 | 104.7 | 148.1 |
| Inventories, % | 6.4 | 6.46 | 13.72 | 8.73 | 6.3 | 8.32 | 8.32 | 8.32 | 8.32 | 8.32 |
| Accounts Payable | 11.0 | 9.1 | 14.6 | 17.5 | 21.1 | 39.2 | 55.5 | 78.5 | 111.1 | 157.2 |
| Accounts Payable, % | 13.96 | 7.67 | 8.4 | 7.42 | 6.71 | 8.83 | 8.83 | 8.83 | 8.83 | 8.83 |
| Capital Expenditure | -7.9 | -8.7 | -15.2 | -.6 | -25.0 | -30.4 | -43.1 | -60.9 | -86.2 | -122.0 |
| Capital Expenditure, % | -9.97 | -7.3 | -8.77 | -0.26354 | -7.95 | -6.85 | -6.85 | -6.85 | -6.85 | -6.85 |
| Tax Rate, % | -28.44 | -28.44 | -28.44 | -28.44 | -28.44 | -28.44 | -28.44 | -28.44 | -28.44 | -28.44 |
| EBITAT | -4.6 | -23.3 | -35.8 | -11.2 | 3.0 | -43.5 | -61.6 | -87.1 | -123.2 | -174.4 |
| Depreciation | ||||||||||
| Changes in Account Receivables | ||||||||||
| Changes in Inventories | ||||||||||
| Changes in Accounts Payable | ||||||||||
| Capital Expenditure | ||||||||||
| UFCF | -14.0 | -34.5 | -61.1 | -49.5 | -13.1 | -48.5 | -107.4 | -151.9 | -214.9 | -304.1 |
| WACC, % | 5.06 | 5.06 | 5.06 | 5.06 | 5.06 | 5.06 | 5.06 | 5.06 | 5.06 | 5.06 |
| PV UFCF | ||||||||||
| SUM PV UFCF | -688.3 | |||||||||
| Long Term Growth Rate, % | 2.00 | |||||||||
| Free cash flow (T + 1) | -310 | |||||||||
| Terminal Value | -10,128 | |||||||||
| Present Terminal Value | -7,912 | |||||||||
| Enterprise Value | -8,601 | |||||||||
| Net Debt | -28 | |||||||||
| Equity Value | -8,572 | |||||||||
| Diluted Shares Outstanding, MM | 36 | |||||||||
| Equity Value Per Share | -239.71 |
ماذا ستتلقى
- بيانات NYAX المالية الدقيقة: يتميز كل من البيانات التاريخية والمتوقعة للتقييم الدقيق.
- مدخلات قابلة للتخصيص: اضبط WACC ومعدلات الضرائب ونمو الإيرادات والنفقات الرأسمالية حسب الحاجة.
- الحسابات الآلية: يتم حساب القيمة الجوهرية و NPV تلقائيًا.
- تحليل السيناريو: استكشف السيناريوهات المختلفة لتقييم الأداء المستقبلي لـ Nayax.
- تصميم سهل الاستخدام: مصممة للمهنيين مع بقاء ودودين للوافدين الجدد.
الميزات الرئيسية
- 🔍 بيانات NYAX المالية الواقعة: البيانات التاريخية والمتوقعة المليئة مسبقًا بـ Nayax Ltd.
- ✏️ مدخلات قابلة للتخصيص بالكامل: تعديل جميع المعلمات الأساسية (الخلايا الصفراء) مثل WACC و Growth ٪ ومعدلات الضرائب.
- 📊 تقييم DCF المهني: تحدد الصيغ المتكاملة القيمة الجوهرية لـ Nayax باستخدام نهج التدفق النقدي المخفض.
- ⚡ النتائج الفورية: تصور على الفور تقييم Nayax بعد أي تعديلات.
- تحليل السيناريو: تقييم النتائج والتباين لافتراضات مالية مختلفة جنبًا إلى جنب.
كيف تعمل
- الخطوة 1: قم بتنزيل ملف Excel لـ Nayax Ltd. (Nyax).
- الخطوة 2: فحص البيانات المالية المملوءة مسبقًا من Nayax.
- الخطوة 3: ضبط المدخلات الرئيسية مثل نمو الإيرادات ، WACC ، ومعدلات الضرائب (الخلايا المميزة).
- الخطوة 4: راقب تحديث نموذج DCF في الوقت الفعلي أثناء تعديل افتراضاتك.
- الخطوة 5: تقييم النتائج والاستفادة من النتائج الخاصة باستراتيجيات الاستثمار الخاصة بك.
لماذا تختار حاسبة Nayax؟
- دقة: يعزز بيانات Nayax المالية الفعلية للحصول على نتائج موثوقة.
- التنوع: تم تصميمه للمستخدمين لضبط وتجربة مدخلات مختلفة بسهولة.
- فعال الوقت: التخلص من الحاجة إلى بناء نموذج DCF من الألف إلى الياء.
- جودة المؤسسة: مصنوع بدقة والوظائف التي تتطلبها المدير المالي.
- حدسي: سهل التنقل ، مناسب للمستخدمين الذين لديهم مستويات مختلفة من الخبرة المالية.
من يجب أن يستخدم هذا المنتج؟
- المستثمرون: قم بتقييم القيمة العادلة لـ Nayax Ltd. (NYAX) بشكل فعال قبل اتخاذ خيارات الاستثمار.
- المدير المالي: الاستفادة من نموذج DCF عالي الجودة لتقارير مالية دقيقة وتحليل شامل.
- الاستشاريون: تخصيص القالب بسرعة لتقارير تقييم العميل.
- رواد الأعمال: اكتشف تقنيات النمذجة المالية المتقدمة التي تستخدمها الشركات الرائدة.
- المعلمون: قم بتطبيقه كمورد تعليمي لتوضيح استراتيجيات التقييم.
ما يتضمنه القالب
- البيانات التاريخية: يحتوي على الأداء المالي السابق لـ Nayax Ltd. (NYAX) والتنبؤ الأساسي.
- نماذج DCF و Ruvered DCF: قوالب شاملة لتحديد القيمة الجوهرية لـ Nayax Ltd. (NYAX).
- ورقة WACC: حسابات تم تشكيلها مسبقًا لمتوسط تكلفة رأس المال المرجح.
- مدخلات قابلة للتحرير: تخصيص العوامل الهامة مثل معدلات النمو وهامش الأرباح قبل الفوائد والضرائب والإهلاك والاستهلاك ، وتقديرات Capex.
- البيانات الفصلية والسنوية: مفصل overview من بيانات Nayax Ltd. (NYAX) المالية.
- لوحة القيادة التفاعلية: تصور ديناميكي نتائج التقييم والتوقعات.
Disclaimer
All information, articles, and product details provided on this website are for general informational and educational purposes only. We do not claim any ownership over, nor do we intend to infringe upon, any trademarks, copyrights, logos, brand names, or other intellectual property mentioned or depicted on this site. Such intellectual property remains the property of its respective owners, and any references here are made solely for identification or informational purposes, without implying any affiliation, endorsement, or partnership.
We make no representations or warranties, express or implied, regarding the accuracy, completeness, or suitability of any content or products presented. Nothing on this website should be construed as legal, tax, investment, financial, medical, or other professional advice. In addition, no part of this site—including articles or product references—constitutes a solicitation, recommendation, endorsement, advertisement, or offer to buy or sell any securities, franchises, or other financial instruments, particularly in jurisdictions where such activity would be unlawful.
All content is of a general nature and may not address the specific circumstances of any individual or entity. It is not a substitute for professional advice or services. Any actions you take based on the information provided here are strictly at your own risk. You accept full responsibility for any decisions or outcomes arising from your use of this website and agree to release us from any liability in connection with your use of, or reliance upon, the content or products found herein.