
|
Nayax Ltd. (NYAX) Avaliação DCF |
Totalmente Editável: Adapte-Se Às Suas Necessidades No Excel Ou Planilhas
Design Profissional: Modelos Confiáveis E Padrão Da Indústria
Pré-Construídos Para Uso Rápido E Eficiente
Compatível com MAC/PC, totalmente desbloqueado
Não É Necessária Experiência; Fácil De Seguir
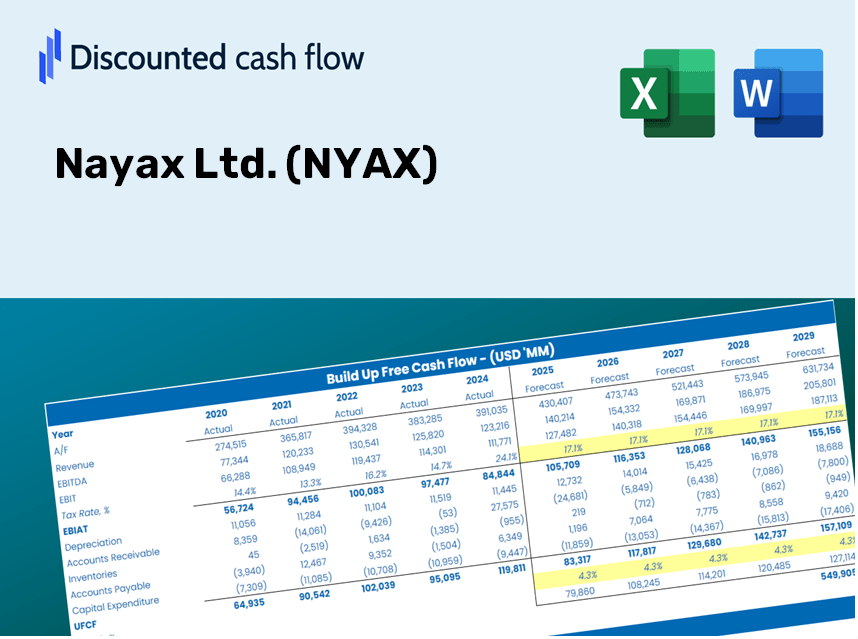
Nayax Ltd. (NYAX) Bundle
Avalie as perspectivas financeiras da Nayax Ltd. como um especialista! Esta calculadora do NYAX DCF fornece finanças pré-carregadas e a liberdade de modificar o crescimento da receita, o WACC, as margens e outras suposições críticas para se alinhar às suas projeções.
Discounted Cash Flow (DCF) - (USD MM)
| Year | AY1 2020 |
AY2 2021 |
AY3 2022 |
AY4 2023 |
AY5 2024 |
FY1 2025 |
FY2 2026 |
FY3 2027 |
FY4 2028 |
FY5 2029 |
|---|---|---|---|---|---|---|---|---|---|---|
| Revenue | 78.8 | 119.1 | 173.5 | 235.5 | 314.0 | 444.3 | 628.6 | 889.3 | 1,258.2 | 1,780.1 |
| Revenue Growth, % | 0 | 51.22 | 45.65 | 35.72 | 33.34 | 41.48 | 41.48 | 41.48 | 41.48 | 41.48 |
| EBITDA | 1.7 | -15.2 | -26.7 | 2.3 | 23.7 | -15.6 | -22.0 | -31.2 | -44.1 | -62.4 |
| EBITDA, % | 2.13 | -12.8 | -15.39 | 0.99347 | 7.55 | -3.5 | -3.5 | -3.5 | -3.5 | -3.5 |
| Depreciation | 6.3 | 7.5 | 8.6 | 12.7 | 21.4 | 28.0 | 39.6 | 56.0 | 79.2 | 112.1 |
| Depreciation, % | 8.03 | 6.28 | 4.97 | 5.39 | 6.81 | 6.3 | 6.3 | 6.3 | 6.3 | 6.3 |
| EBIT | -4.7 | -22.7 | -35.3 | -10.4 | 2.3 | -43.5 | -61.6 | -87.2 | -123.3 | -174.5 |
| EBIT, % | -5.9 | -19.08 | -20.36 | -4.4 | 0.74105 | -9.8 | -9.8 | -9.8 | -9.8 | -9.8 |
| Total Cash | 8.3 | 87.4 | 34.0 | 39.7 | 92.5 | 133.0 | 188.2 | 266.3 | 376.7 | 533.0 |
| Total Cash, percent | .0 | .0 | .0 | .0 | .0 | .0 | .0 | .0 | .0 | .0 |
| Account Receivables | 13.8 | 19.3 | 27.4 | 83.9 | 100.8 | 104.2 | 147.5 | 208.6 | 295.2 | 417.6 |
| Account Receivables, % | 17.57 | 16.23 | 15.8 | 35.61 | 32.09 | 23.46 | 23.46 | 23.46 | 23.46 | 23.46 |
| Inventories | 5.0 | 7.7 | 23.8 | 20.6 | 19.8 | 37.0 | 52.3 | 74.0 | 104.7 | 148.1 |
| Inventories, % | 6.4 | 6.46 | 13.72 | 8.73 | 6.3 | 8.32 | 8.32 | 8.32 | 8.32 | 8.32 |
| Accounts Payable | 11.0 | 9.1 | 14.6 | 17.5 | 21.1 | 39.2 | 55.5 | 78.5 | 111.1 | 157.2 |
| Accounts Payable, % | 13.96 | 7.67 | 8.4 | 7.42 | 6.71 | 8.83 | 8.83 | 8.83 | 8.83 | 8.83 |
| Capital Expenditure | -7.9 | -8.7 | -15.2 | -.6 | -25.0 | -30.4 | -43.1 | -60.9 | -86.2 | -122.0 |
| Capital Expenditure, % | -9.97 | -7.3 | -8.77 | -0.26354 | -7.95 | -6.85 | -6.85 | -6.85 | -6.85 | -6.85 |
| Tax Rate, % | -28.44 | -28.44 | -28.44 | -28.44 | -28.44 | -28.44 | -28.44 | -28.44 | -28.44 | -28.44 |
| EBITAT | -4.6 | -23.3 | -35.8 | -11.2 | 3.0 | -43.5 | -61.6 | -87.1 | -123.2 | -174.4 |
| Depreciation | ||||||||||
| Changes in Account Receivables | ||||||||||
| Changes in Inventories | ||||||||||
| Changes in Accounts Payable | ||||||||||
| Capital Expenditure | ||||||||||
| UFCF | -14.0 | -34.5 | -61.1 | -49.5 | -13.1 | -48.5 | -107.4 | -151.9 | -214.9 | -304.1 |
| WACC, % | 5.06 | 5.06 | 5.06 | 5.06 | 5.06 | 5.06 | 5.06 | 5.06 | 5.06 | 5.06 |
| PV UFCF | ||||||||||
| SUM PV UFCF | -688.3 | |||||||||
| Long Term Growth Rate, % | 2.00 | |||||||||
| Free cash flow (T + 1) | -310 | |||||||||
| Terminal Value | -10,128 | |||||||||
| Present Terminal Value | -7,912 | |||||||||
| Enterprise Value | -8,601 | |||||||||
| Net Debt | -28 | |||||||||
| Equity Value | -8,572 | |||||||||
| Diluted Shares Outstanding, MM | 36 | |||||||||
| Equity Value Per Share | -239.71 |
What You Will Receive
- Accurate NYAX Financials: Features both historical and projected data for precise valuation.
- Customizable Inputs: Adjust WACC, tax rates, revenue growth, and capital expenditures as needed.
- Automated Calculations: Intrinsic value and NPV are computed automatically.
- Scenario Analysis: Explore various scenarios to assess Nayax's future performance.
- User-Friendly Design: Designed for professionals while remaining approachable for newcomers.
Key Features
- 🔍 Real-Life NYAX Financials: Pre-filled historical and projected data for Nayax Ltd.
- ✏️ Fully Customizable Inputs: Modify all essential parameters (yellow cells) such as WACC, growth %, and tax rates.
- 📊 Professional DCF Valuation: Integrated formulas determine Nayax's intrinsic value using the Discounted Cash Flow approach.
- ⚡ Instant Results: Immediately visualize Nayax's valuation following any adjustments.
- Scenario Analysis: Evaluate and contrast results for different financial assumptions side-by-side.
How It Functions
- Step 1: Download the Excel file for Nayax Ltd. (NYAX).
- Step 2: Examine Nayax's pre-filled financial data and projections.
- Step 3: Adjust key inputs such as revenue growth, WACC, and tax rates (highlighted cells).
- Step 4: Observe the DCF model update in real-time as you modify your assumptions.
- Step 5: Evaluate the results and leverage the findings for your investment strategies.
Why Opt for the Nayax Calculator?
- Precision: Leverages actual Nayax financial data for reliable results.
- Versatility: Built for users to easily adjust and experiment with various inputs.
- Time-Efficient: Eliminate the need to construct a DCF model from the ground up.
- Enterprise-Quality: Crafted with the precision and functionality that CFOs demand.
- Intuitive: Simple to navigate, suitable for users with varying levels of financial expertise.
Who Should Use This Product?
- Investors: Effectively evaluate Nayax Ltd.'s (NYAX) fair value prior to making investment choices.
- CFOs: Utilize a high-quality DCF model for accurate financial reporting and comprehensive analysis.
- Consultants: Swiftly customize the template for client valuation reports.
- Entrepreneurs: Discover advanced financial modeling techniques employed by leading companies.
- Educators: Apply it as an educational resource to illustrate valuation strategies.
What the Template Includes
- Historical Data: Contains Nayax Ltd.'s (NYAX) previous financial performance and baseline forecasts.
- DCF and Levered DCF Models: Comprehensive templates for determining Nayax Ltd.'s (NYAX) intrinsic value.
- WACC Sheet: Pre-formed calculations for the Weighted Average Cost of Capital.
- Editable Inputs: Customize critical factors such as growth rates, EBITDA margins, and CAPEX estimates.
- Quarterly and Annual Statements: Detailed overview of Nayax Ltd.'s (NYAX) financial data.
- Interactive Dashboard: Dynamically visualize valuation results and forecasts.
Disclaimer
All information, articles, and product details provided on this website are for general informational and educational purposes only. We do not claim any ownership over, nor do we intend to infringe upon, any trademarks, copyrights, logos, brand names, or other intellectual property mentioned or depicted on this site. Such intellectual property remains the property of its respective owners, and any references here are made solely for identification or informational purposes, without implying any affiliation, endorsement, or partnership.
We make no representations or warranties, express or implied, regarding the accuracy, completeness, or suitability of any content or products presented. Nothing on this website should be construed as legal, tax, investment, financial, medical, or other professional advice. In addition, no part of this site—including articles or product references—constitutes a solicitation, recommendation, endorsement, advertisement, or offer to buy or sell any securities, franchises, or other financial instruments, particularly in jurisdictions where such activity would be unlawful.
All content is of a general nature and may not address the specific circumstances of any individual or entity. It is not a substitute for professional advice or services. Any actions you take based on the information provided here are strictly at your own risk. You accept full responsibility for any decisions or outcomes arising from your use of this website and agree to release us from any liability in connection with your use of, or reliance upon, the content or products found herein.