
|
Oak Valley Bancorp (Ovly) DCF تقييم |
Fully Editable: Tailor To Your Needs In Excel Or Sheets
Professional Design: Trusted, Industry-Standard Templates
Investor-Approved Valuation Models
MAC/PC Compatible, Fully Unlocked
No Expertise Is Needed; Easy To Follow
Oak Valley Bancorp (OVLY) Bundle
اكتساب نظرة ثاقبة على تحليل تقييم Oak Valley Bancorp (Ovly) مع حاسبة DCF القوية لدينا! يأتي قالب Excel هذا مسبقًا ببيانات حقيقية ، مما يمكّنك من ضبط التوقعات والافتراضات لتحديد القيمة الجوهرية لـ Oak Valley Bancorp بدقة.
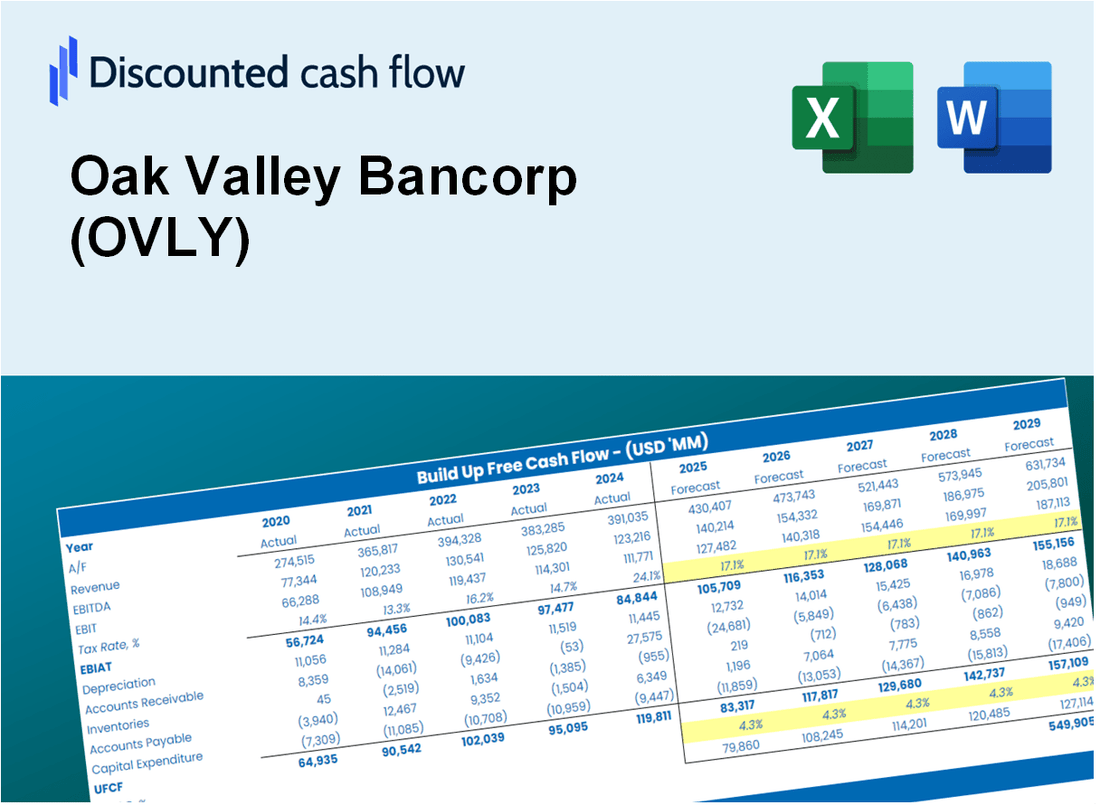
Discounted Cash Flow (DCF) - (USD MM)
| Year | AY1 2020 |
AY2 2021 |
AY3 2022 |
AY4 2023 |
AY5 2024 |
FY1 2025 |
FY2 2026 |
FY3 2027 |
FY4 2028 |
FY5 2029 |
|---|---|---|---|---|---|---|---|---|---|---|
| Revenue | 50.9 | 55.2 | 66.8 | 87.3 | 89.4 | 103.4 | 119.6 | 138.3 | 160.0 | 185.0 |
| Revenue Growth, % | 0 | 8.46 | 20.88 | 30.75 | 2.47 | 15.64 | 15.64 | 15.64 | 15.64 | 15.64 |
| EBITDA | 18.9 | 22.8 | 30.8 | 41.4 | 33.3 | 43.3 | 50.1 | 57.9 | 67.0 | 77.4 |
| EBITDA, % | 37.2 | 41.31 | 46.19 | 47.43 | 37.21 | 41.87 | 41.87 | 41.87 | 41.87 | 41.87 |
| Depreciation | 1.2 | 1.1 | 1.2 | 1.1 | 1.1 | 1.8 | 2.1 | 2.4 | 2.8 | 3.2 |
| Depreciation, % | 2.35 | 2.07 | 1.72 | 1.26 | 1.22 | 1.73 | 1.73 | 1.73 | 1.73 | 1.73 |
| EBIT | 17.7 | 21.7 | 29.7 | 40.3 | 32.2 | 41.5 | 48.0 | 55.5 | 64.2 | 74.3 |
| EBIT, % | 34.84 | 39.25 | 44.47 | 46.17 | 35.99 | 40.14 | 40.14 | 40.14 | 40.14 | 40.14 |
| Total Cash | 410.7 | 998.2 | 943.2 | 698.1 | 213.6 | 103.4 | 119.6 | 138.3 | 160.0 | 185.0 |
| Total Cash, percent | .0 | .0 | .0 | .0 | .0 | .0 | .0 | .0 | .0 | .0 |
| Account Receivables | 5.7 | 4.1 | 7.9 | 8.4 | 8.6 | 10.3 | 11.9 | 13.7 | 15.9 | 18.3 |
| Account Receivables, % | 11.17 | 7.35 | 11.88 | 9.61 | 9.57 | 9.91 | 9.91 | 9.91 | 9.91 | 9.91 |
| Inventories | .0 | .0 | .0 | .0 | .0 | .0 | .0 | .0 | .0 | .0 |
| Inventories, % | 0 | 0 | 0 | 0 | 0 | 0 | 0 | 0 | 0 | 0 |
| Accounts Payable | 14.0 | 14.9 | 27.4 | .0 | .0 | 19.8 | 22.8 | 26.4 | 30.5 | 35.3 |
| Accounts Payable, % | 27.44 | 26.98 | 41.07 | 0 | 0 | 19.1 | 19.1 | 19.1 | 19.1 | 19.1 |
| Capital Expenditure | -1.7 | -1.0 | -1.2 | -1.9 | -1.8 | -2.3 | -2.7 | -3.1 | -3.6 | -4.1 |
| Capital Expenditure, % | -3.42 | -1.77 | -1.78 | -2.17 | -1.99 | -2.23 | -2.23 | -2.23 | -2.23 | -2.23 |
| Tax Rate, % | 22.5 | 22.5 | 22.5 | 22.5 | 22.5 | 22.5 | 22.5 | 22.5 | 22.5 | 22.5 |
| EBITAT | 13.7 | 16.3 | 22.9 | 30.8 | 24.9 | 31.9 | 36.8 | 42.6 | 49.3 | 57.0 |
| Depreciation | ||||||||||
| Changes in Account Receivables | ||||||||||
| Changes in Inventories | ||||||||||
| Changes in Accounts Payable | ||||||||||
| Capital Expenditure | ||||||||||
| UFCF | 21.4 | 19.1 | 31.5 | 2.2 | 24.1 | 49.4 | 37.7 | 43.6 | 50.5 | 58.4 |
| WACC, % | 4.91 | 4.91 | 4.91 | 4.91 | 4.91 | 4.91 | 4.91 | 4.91 | 4.91 | 4.91 |
| PV UFCF | ||||||||||
| SUM PV UFCF | 206.7 | |||||||||
| Long Term Growth Rate, % | 2.00 | |||||||||
| Free cash flow (T + 1) | 60 | |||||||||
| Terminal Value | 2,045 | |||||||||
| Present Terminal Value | 1,609 | |||||||||
| Enterprise Value | 1,816 | |||||||||
| Net Debt | -138 | |||||||||
| Equity Value | 1,954 | |||||||||
| Diluted Shares Outstanding, MM | 8 | |||||||||
| Equity Value Per Share | 236.62 |
What You Will Get
- Real OVLY Financial Data: Pre-filled with Oak Valley Bancorp’s historical and projected data for precise analysis.
- Fully Editable Template: Modify key inputs like revenue growth, WACC, and EBITDA % with ease.
- Automatic Calculations: See Oak Valley Bancorp’s intrinsic value update instantly based on your changes.
- Professional Valuation Tool: Designed for investors, analysts, and consultants seeking accurate DCF results.
- User-Friendly Design: Simple structure and clear instructions for all experience levels.
Key Features
- Customizable Financial Metrics: Adjust essential inputs such as loan growth, net interest margin, and operating expenses.
- Instant DCF Valuation: Automatically computes intrinsic value, NPV, and additional financial metrics in real time.
- High-Precision Results: Leverages Oak Valley Bancorp's (OVLY) actual financial data for accurate valuation insights.
- Streamlined Scenario Testing: Easily evaluate various assumptions and analyze different financial outcomes.
- Efficiency Booster: Avoid the hassle of creating intricate valuation models from the ground up.
How It Works
- Step 1: Download the prebuilt Excel template featuring Oak Valley Bancorp’s (OVLY) data.
- Step 2: Navigate through the pre-filled sheets to grasp the essential metrics.
- Step 3: Update forecasts and assumptions in the editable yellow cells (WACC, growth, margins).
- Step 4: Instantly view recalculated results, including Oak Valley Bancorp’s (OVLY) intrinsic value.
- Step 5: Make informed investment decisions or create reports based on the outputs.
Why Choose This Calculator for Oak Valley Bancorp (OVLY)?
- Designed for Experts: A sophisticated tool favored by financial analysts, CFOs, and investment consultants.
- Accurate Financial Data: Oak Valley Bancorp’s historical and projected financials are preloaded for precision.
- Flexible Scenario Analysis: Effortlessly test various forecasts and assumptions.
- Comprehensive Outputs: Instantly calculates intrinsic value, NPV, and essential financial metrics.
- User-Friendly Interface: Step-by-step guidance ensures a smooth calculation process.
Who Should Use This Product?
- Investors: Evaluate Oak Valley Bancorp’s (OVLY) valuation before making investment decisions.
- CFOs and Financial Analysts: Optimize valuation methodologies and assess financial forecasts.
- Startup Founders: Understand the valuation strategies of established banks like Oak Valley Bancorp.
- Consultants: Provide clients with comprehensive valuation analysis and reports.
- Students and Educators: Utilize current data to learn and teach banking valuation principles.
What the Template Contains
- Comprehensive DCF Model: Editable template featuring detailed valuation calculations for Oak Valley Bancorp (OVLY).
- Real-World Data: Oak Valley Bancorp’s historical and projected financials preloaded for in-depth analysis.
- Customizable Parameters: Modify WACC, growth rates, and tax assumptions to explore various scenarios.
- Financial Statements: Complete annual and quarterly breakdowns for enhanced insights into financial performance.
- Key Ratios: Integrated analysis for profitability, efficiency, and leverage specific to Oak Valley Bancorp (OVLY).
- Dashboard with Visual Outputs: Charts and tables designed for clear and actionable results.
Disclaimer
All information, articles, and product details provided on this website are for general informational and educational purposes only. We do not claim any ownership over, nor do we intend to infringe upon, any trademarks, copyrights, logos, brand names, or other intellectual property mentioned or depicted on this site. Such intellectual property remains the property of its respective owners, and any references here are made solely for identification or informational purposes, without implying any affiliation, endorsement, or partnership.
We make no representations or warranties, express or implied, regarding the accuracy, completeness, or suitability of any content or products presented. Nothing on this website should be construed as legal, tax, investment, financial, medical, or other professional advice. In addition, no part of this site—including articles or product references—constitutes a solicitation, recommendation, endorsement, advertisement, or offer to buy or sell any securities, franchises, or other financial instruments, particularly in jurisdictions where such activity would be unlawful.
All content is of a general nature and may not address the specific circumstances of any individual or entity. It is not a substitute for professional advice or services. Any actions you take based on the information provided here are strictly at your own risk. You accept full responsibility for any decisions or outcomes arising from your use of this website and agree to release us from any liability in connection with your use of, or reliance upon, the content or products found herein.