
|
تقييم Oxford Industries ، Inc. (OXM) DCF |
Fully Editable: Tailor To Your Needs In Excel Or Sheets
Professional Design: Trusted, Industry-Standard Templates
Investor-Approved Valuation Models
MAC/PC Compatible, Fully Unlocked
No Expertise Is Needed; Easy To Follow
Oxford Industries, Inc. (OXM) Bundle
قم بتحسين وقتك وتحسين الدقة باستخدام حاسبة DCF (OXM)! مجهزة ببيانات Oxford Industries ، Inc. الحالية والافتراضات القابلة للتخصيص ، تتيح لك هذه الأداة التنبؤ وتحليل وقيمة (OXM) تمامًا مثل المستثمر المحنك.
What You Will Receive
- Comprehensive Financial Model: Utilize Oxford Industries' actual data for accurate DCF valuation.
- Complete Forecast Flexibility: Modify revenue growth, profit margins, WACC, and other essential parameters.
- Real-Time Calculations: Automatic updates provide immediate insights as you adjust inputs.
- Professional-Grade Template: A polished Excel file crafted for high-quality valuation presentations.
- Adaptable and Reusable: Designed for versatility, enabling repeated application for in-depth forecasts.
Key Features
- Comprehensive Historical Data: Oxford Industries, Inc.'s (OXM) past financial statements and comprehensive forecasts.
- Customizable Parameters: Adjust WACC, tax rates, revenue growth, and EBITDA margins to fit your analysis.
- Real-Time Valuation: Instantly view the recalculated intrinsic value of Oxford Industries, Inc. (OXM).
- Intuitive Visualizations: Engaging dashboard charts illustrate valuation results and essential metrics.
- Designed for Precision: A reliable tool tailored for analysts, investors, and finance professionals.
How It Works
- Step 1: Download the Excel file.
- Step 2: Review pre-entered Oxford Industries, Inc. (OXM) data (historical and projected).
- Step 3: Adjust key assumptions (yellow cells) based on your analysis.
- Step 4: View automatic recalculations for Oxford Industries, Inc. (OXM)'s intrinsic value.
- Step 5: Use the outputs for investment decisions or reporting.
Why Choose This Calculator for Oxford Industries, Inc. (OXM)?
- All-in-One Solution: Features DCF, WACC, and financial ratio evaluations consolidated in a single tool.
- Flexible Inputs: Modify the yellow-highlighted fields to explore different financial scenarios.
- In-Depth Analysis: Automatically computes Oxford Industries’ intrinsic value and Net Present Value.
- Data Ready: Comes with historical and projected data for precise calculations.
- High-Quality Output: Perfect for financial analysts, investors, and business advisors.
Who Should Use This Product?
- Individual Investors: Make informed decisions about buying or selling Oxford Industries, Inc. (OXM) stock.
- Financial Analysts: Streamline valuation processes with ready-to-use financial models for Oxford Industries, Inc. (OXM).
- Consultants: Deliver professional valuation insights on Oxford Industries, Inc. (OXM) to clients quickly and accurately.
- Business Owners: Understand how companies like Oxford Industries, Inc. (OXM) are valued to guide your own strategy.
- Finance Students: Learn valuation techniques using real-world data and scenarios involving Oxford Industries, Inc. (OXM).
What the Template Contains
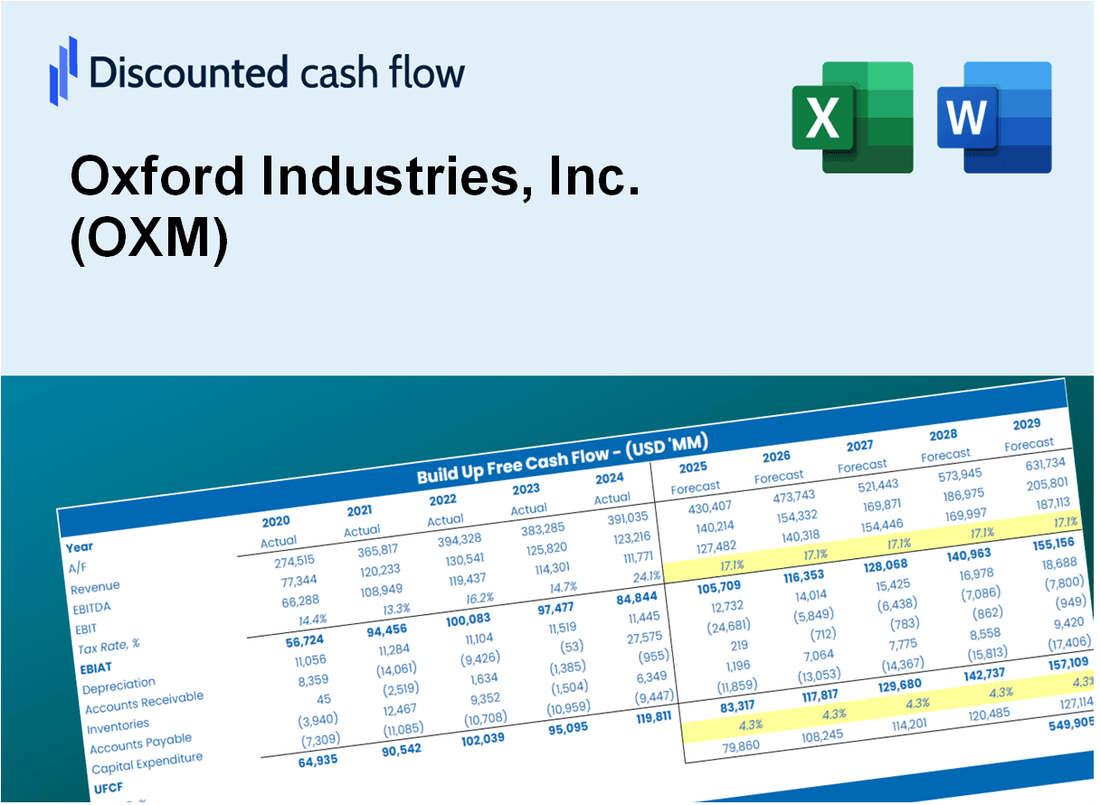
- Operating and Balance Sheet Data: Pre-filled Oxford Industries historical data and forecasts, including revenue, EBITDA, EBIT, and capital expenditures.
- WACC Calculation: A dedicated sheet for Weighted Average Cost of Capital (WACC), including parameters like Beta, risk-free rate, and share price.
- DCF Valuation (Unlevered and Levered): Editable Discounted Cash Flow models showing intrinsic value with detailed calculations.
- Financial Statements: Pre-loaded financial statements (annual and quarterly) to support analysis.
- Key Ratios: Includes profitability, leverage, and efficiency ratios for Oxford Industries, Inc. (OXM).
- Dashboard and Charts: Visual summary of valuation outputs and assumptions to analyze results easily.
Disclaimer
All information, articles, and product details provided on this website are for general informational and educational purposes only. We do not claim any ownership over, nor do we intend to infringe upon, any trademarks, copyrights, logos, brand names, or other intellectual property mentioned or depicted on this site. Such intellectual property remains the property of its respective owners, and any references here are made solely for identification or informational purposes, without implying any affiliation, endorsement, or partnership.
We make no representations or warranties, express or implied, regarding the accuracy, completeness, or suitability of any content or products presented. Nothing on this website should be construed as legal, tax, investment, financial, medical, or other professional advice. In addition, no part of this site—including articles or product references—constitutes a solicitation, recommendation, endorsement, advertisement, or offer to buy or sell any securities, franchises, or other financial instruments, particularly in jurisdictions where such activity would be unlawful.
All content is of a general nature and may not address the specific circumstances of any individual or entity. It is not a substitute for professional advice or services. Any actions you take based on the information provided here are strictly at your own risk. You accept full responsibility for any decisions or outcomes arising from your use of this website and agree to release us from any liability in connection with your use of, or reliance upon, the content or products found herein.