
|
تقييم البنك المفضل (PFBC) DCF |
Fully Editable: Tailor To Your Needs In Excel Or Sheets
Professional Design: Trusted, Industry-Standard Templates
Investor-Approved Valuation Models
MAC/PC Compatible, Fully Unlocked
No Expertise Is Needed; Easy To Follow
Preferred Bank (PFBC) Bundle
تقييم التوقعات المالية للبنك المفضل مثل خبير! توفر حاسبة DCF (PFBC) هذه البيانات المالية المليئة مسبقًا إلى جانب المرونة الكاملة لتعديل نمو الإيرادات ، و WACC ، والهوامش ، وغيرها من الافتراضات الأساسية التي تتماشى مع توقعاتك.
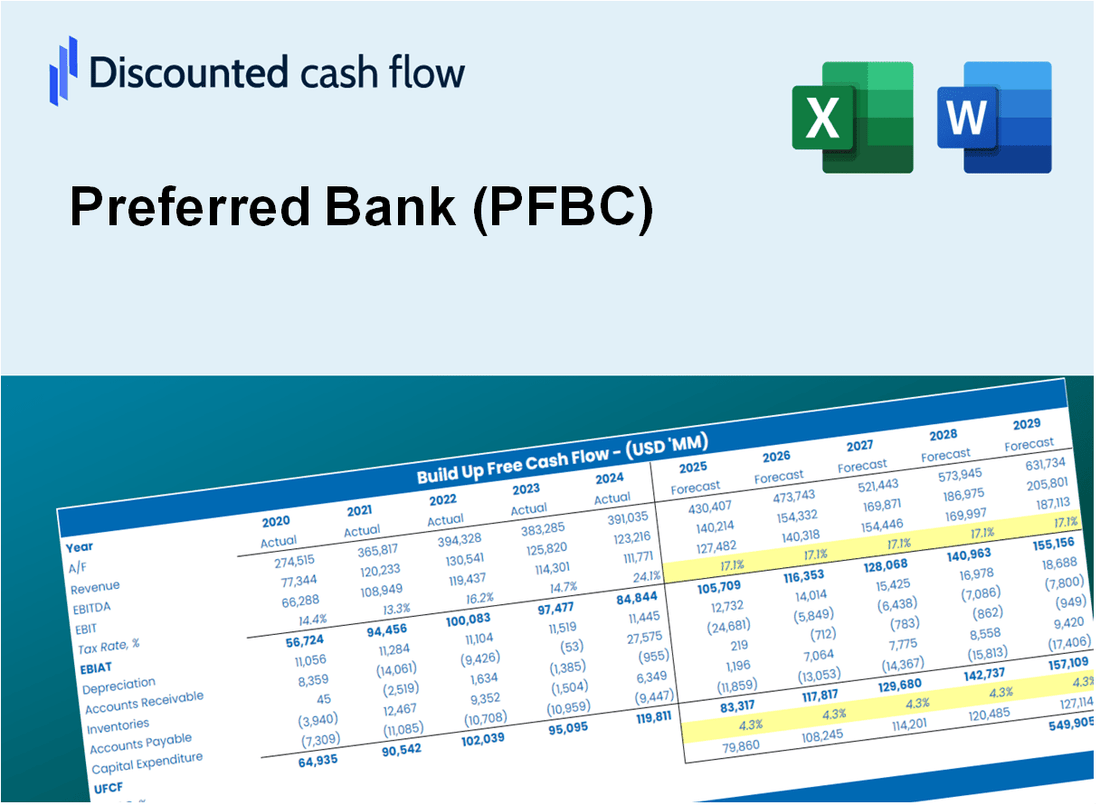
Discounted Cash Flow (DCF) - (USD MM)
| Year | AY1 2020 |
AY2 2021 |
AY3 2022 |
AY4 2023 |
AY5 2024 |
FY1 2025 |
FY2 2026 |
FY3 2027 |
FY4 2028 |
FY5 2029 |
|---|---|---|---|---|---|---|---|---|---|---|
| Revenue | 220.3 | 218.8 | 301.4 | 481.8 | 520.4 | 656.9 | 829.3 | 1,046.8 | 1,321.4 | 1,668.1 |
| Revenue Growth, % | 0 | -0.69944 | 37.78 | 59.83 | 8.03 | 26.23 | 26.23 | 26.23 | 26.23 | 26.23 |
| EBITDA | 98.8 | 135.7 | 181.1 | 211.6 | 186.2 | 324.1 | 409.1 | 516.4 | 651.8 | 822.8 |
| EBITDA, % | 44.83 | 62.04 | 60.08 | 43.92 | 35.78 | 49.33 | 49.33 | 49.33 | 49.33 | 49.33 |
| Depreciation | 1.9 | 1.9 | 1.9 | 1.7 | 2.2 | 4.1 | 5.2 | 6.5 | 8.3 | 10.4 |
| Depreciation, % | 0.86239 | 0.86617 | 0.62702 | 0.35703 | 0.41331 | 0.62518 | 0.62518 | 0.62518 | 0.62518 | 0.62518 |
| EBIT | 96.9 | 133.8 | 179.2 | 209.9 | 184.0 | 319.9 | 403.9 | 509.8 | 643.6 | 812.4 |
| EBIT, % | 43.97 | 61.17 | 59.45 | 43.56 | 35.36 | 48.7 | 48.7 | 48.7 | 48.7 | 48.7 |
| Total Cash | 979.1 | 1,482.5 | 1,175.8 | 1,204.7 | 765.5 | 656.9 | 829.3 | 1,046.8 | 1,321.4 | 1,668.1 |
| Total Cash, percent | .0 | .0 | .0 | .0 | .0 | .0 | .0 | .0 | .0 | .0 |
| Account Receivables | 23.7 | 14.6 | 23.6 | 36.3 | 35.8 | 52.1 | 65.8 | 83.1 | 104.9 | 132.4 |
| Account Receivables, % | 10.75 | 6.69 | 7.83 | 7.53 | 6.87 | 7.94 | 7.94 | 7.94 | 7.94 | 7.94 |
| Inventories | .0 | .0 | .0 | .0 | .0 | .0 | .0 | .0 | .0 | .0 |
| Inventories, % | 0 | 0 | 0 | 0 | 0 | 0 | 0 | 0 | 0 | 0 |
| Accounts Payable | 1.2 | .7 | 2.6 | 16.1 | 16.5 | 10.9 | 13.7 | 17.3 | 21.9 | 27.6 |
| Accounts Payable, % | 0.56509 | 0.32682 | 0.86522 | 3.35 | 3.17 | 1.66 | 1.66 | 1.66 | 1.66 | 1.66 |
| Capital Expenditure | -1.5 | -.6 | -.4 | -2.4 | -.9 | -2.3 | -2.9 | -3.7 | -4.6 | -5.8 |
| Capital Expenditure, % | -0.67992 | -0.27562 | -0.11811 | -0.50129 | -0.17659 | -0.35031 | -0.35031 | -0.35031 | -0.35031 | -0.35031 |
| Tax Rate, % | 29 | 29 | 29 | 29 | 29 | 29 | 29 | 29 | 29 | 29 |
| EBITAT | 69.5 | 95.2 | 128.8 | 150.0 | 130.7 | 228.6 | 288.6 | 364.3 | 459.9 | 580.5 |
| Depreciation | ||||||||||
| Changes in Account Receivables | ||||||||||
| Changes in Inventories | ||||||||||
| Changes in Accounts Payable | ||||||||||
| Capital Expenditure | ||||||||||
| UFCF | 47.4 | 105.0 | 123.3 | 150.2 | 132.8 | 208.4 | 280.1 | 353.5 | 446.3 | 563.3 |
| WACC, % | 18.48 | 18.39 | 18.51 | 18.44 | 18.36 | 18.43 | 18.43 | 18.43 | 18.43 | 18.43 |
| PV UFCF | ||||||||||
| SUM PV UFCF | 1,057.0 | |||||||||
| Long Term Growth Rate, % | 2.00 | |||||||||
| Free cash flow (T + 1) | 575 | |||||||||
| Terminal Value | 3,496 | |||||||||
| Present Terminal Value | 1,500 | |||||||||
| Enterprise Value | 2,557 | |||||||||
| Net Debt | -600 | |||||||||
| Equity Value | 3,157 | |||||||||
| Diluted Shares Outstanding, MM | 14 | |||||||||
| Equity Value Per Share | 232.95 |
What You Will Receive
- Comprehensive Financial Model: Preferred Bank's (PFBC) actual data facilitates accurate DCF valuation.
- Complete Forecasting Control: Modify revenue growth, profit margins, WACC, and other essential factors.
- Real-Time Calculations: Automatic updates provide immediate results as you adjust inputs.
- Professional-Grade Template: A polished Excel file crafted for high-quality valuation presentations.
- Flexible and Reusable: Designed for adaptability, allowing for repeated applications in detailed forecasting.
Key Features
- Comprehensive DCF Calculator: Features detailed unlevered and levered DCF valuation models tailored for Preferred Bank (PFBC).
- WACC Calculator: Pre-configured Weighted Average Cost of Capital sheet with adjustable inputs for personalized analysis.
- Customizable Forecast Assumptions: Easily adjust growth rates, capital expenditures, and discount rates to fit your projections.
- Integrated Financial Ratios: Evaluate profitability, leverage, and efficiency ratios specifically for Preferred Bank (PFBC).
- Interactive Dashboard and Charts: Visual representations summarize essential valuation metrics for straightforward analysis.
How It Works
- Download the Template: Gain immediate access to the Excel-based PFBC DCF Calculator.
- Input Your Assumptions: Modify the yellow-highlighted cells for growth rates, WACC, margins, and other variables.
- Instant Calculations: The model will automatically refresh Preferred Bank’s intrinsic value.
- Test Scenarios: Experiment with various assumptions to assess potential changes in valuation.
- Analyze and Decide: Utilize the results to inform your investment or financial analysis.
Why Choose This Calculator for Preferred Bank (PFBC)?
- User-Friendly Interface: Tailored for both novice users and seasoned professionals.
- Customizable Inputs: Adjust parameters effortlessly to suit your financial analysis.
- Real-Time Feedback: Witness immediate updates to Preferred Bank's valuation as you tweak the inputs.
- Pre-Configured Data: Comes equipped with Preferred Bank's actual financial metrics for swift evaluations.
- Relied Upon by Experts: Favored by investors and analysts for making well-informed choices.
Who Should Use This Product?
- Investors: Accurately assess Preferred Bank’s (PFBC) fair value prior to making investment choices.
- CFOs: Utilize a professional-grade DCF model for comprehensive financial reporting and analysis.
- Consultants: Efficiently modify the template for valuation reports tailored to clients.
- Entrepreneurs: Acquire insights into financial modeling practices employed by leading banks.
- Educators: Implement it as a teaching resource to illustrate valuation techniques.
What the Template Contains
- Preloaded PFBC Data: Historical and projected financial data, including revenue, EBIT, and capital expenditures.
- DCF and WACC Models: Professional-grade sheets for calculating intrinsic value and Weighted Average Cost of Capital.
- Editable Inputs: Yellow-highlighted cells for adjusting revenue growth, tax rates, and discount rates.
- Financial Statements: Comprehensive annual and quarterly financials for deeper analysis.
- Key Ratios: Profitability, leverage, and efficiency ratios to evaluate performance.
- Dashboard and Charts: Visual summaries of valuation outcomes and assumptions.
Disclaimer
All information, articles, and product details provided on this website are for general informational and educational purposes only. We do not claim any ownership over, nor do we intend to infringe upon, any trademarks, copyrights, logos, brand names, or other intellectual property mentioned or depicted on this site. Such intellectual property remains the property of its respective owners, and any references here are made solely for identification or informational purposes, without implying any affiliation, endorsement, or partnership.
We make no representations or warranties, express or implied, regarding the accuracy, completeness, or suitability of any content or products presented. Nothing on this website should be construed as legal, tax, investment, financial, medical, or other professional advice. In addition, no part of this site—including articles or product references—constitutes a solicitation, recommendation, endorsement, advertisement, or offer to buy or sell any securities, franchises, or other financial instruments, particularly in jurisdictions where such activity would be unlawful.
All content is of a general nature and may not address the specific circumstances of any individual or entity. It is not a substitute for professional advice or services. Any actions you take based on the information provided here are strictly at your own risk. You accept full responsibility for any decisions or outcomes arising from your use of this website and agree to release us from any liability in connection with your use of, or reliance upon, the content or products found herein.