
|
Power Integrations ، Inc. (Powi) DCF تقييم |
Fully Editable: Tailor To Your Needs In Excel Or Sheets
Professional Design: Trusted, Industry-Standard Templates
Investor-Approved Valuation Models
MAC/PC Compatible, Fully Unlocked
No Expertise Is Needed; Easy To Follow
Power Integrations, Inc. (POWI) Bundle
عزز خيارات الاستثمار الخاصة بك مع حاسبة Power Integrations ، Inc. (POWI) DCF! الاستفادة من البيانات المالية الحقيقية لتكامل الطاقة ، وضبط توقعات النمو والنفقات ، ومراقبة بسرعة كيف تؤثر هذه التغييرات على القيمة الجوهرية لدمج الطاقة ، Inc. (POWI).
What You Will Get
- Real POWI Financial Data: Pre-filled with Power Integrations’ historical and projected data for precise analysis.
- Fully Editable Template: Modify key inputs like revenue growth, WACC, and EBITDA % with ease.
- Automatic Calculations: See Power Integrations’ intrinsic value update instantly based on your changes.
- Professional Valuation Tool: Designed for investors, analysts, and consultants seeking accurate DCF results.
- User-Friendly Design: Simple structure and clear instructions for all experience levels.
Key Features
- Comprehensive Data: Power Integrations’ historical financial reports and pre-loaded forecasts.
- Customizable Inputs: Adjust WACC, tax rates, revenue growth, and EBITDA margins as needed.
- Real-Time Results: Monitor Power Integrations’ intrinsic value recalculating instantly.
- Intuitive Visual Outputs: Dashboard graphs showcase valuation outcomes and essential metrics.
- Designed for Precision: A reliable tool for analysts, investors, and finance professionals.
How It Works
- Download the Template: Gain immediate access to the Excel-based POWI DCF Calculator.
- Input Your Assumptions: Modify the yellow-highlighted cells for growth rates, WACC, margins, and other key factors.
- Instant Calculations: The model automatically recalculates Power Integrations’ intrinsic value.
- Test Scenarios: Experiment with various assumptions to assess potential changes in valuation.
- Analyze and Decide: Utilize the findings to inform your investment or financial decision-making.
Why Choose This Calculator?
- User-Friendly Interface: Perfect for both novices and seasoned professionals.
- Customizable Inputs: Adjust parameters easily to suit your financial analysis.
- Real-Time Feedback: Observe immediate updates to Power Integrations, Inc.'s (POWI) valuation as you tweak inputs.
- Preloaded Data: Comes with Power Integrations, Inc.'s (POWI) actual financial figures for swift evaluations.
- Preferred by Experts: Utilized by financial analysts and investors for making well-informed choices.
Who Should Use Power Integrations, Inc. (POWI)?
- Investors: Gain insights and make informed decisions with advanced semiconductor solutions.
- Electrical Engineers: Streamline design processes with cutting-edge power management technologies.
- Product Developers: Efficiently integrate high-performance components into your designs.
- Energy Efficiency Advocates: Explore innovative products that enhance energy savings and sustainability.
- Educators and Students: Utilize real-world applications of power electronics in academic settings.
What the Template Contains
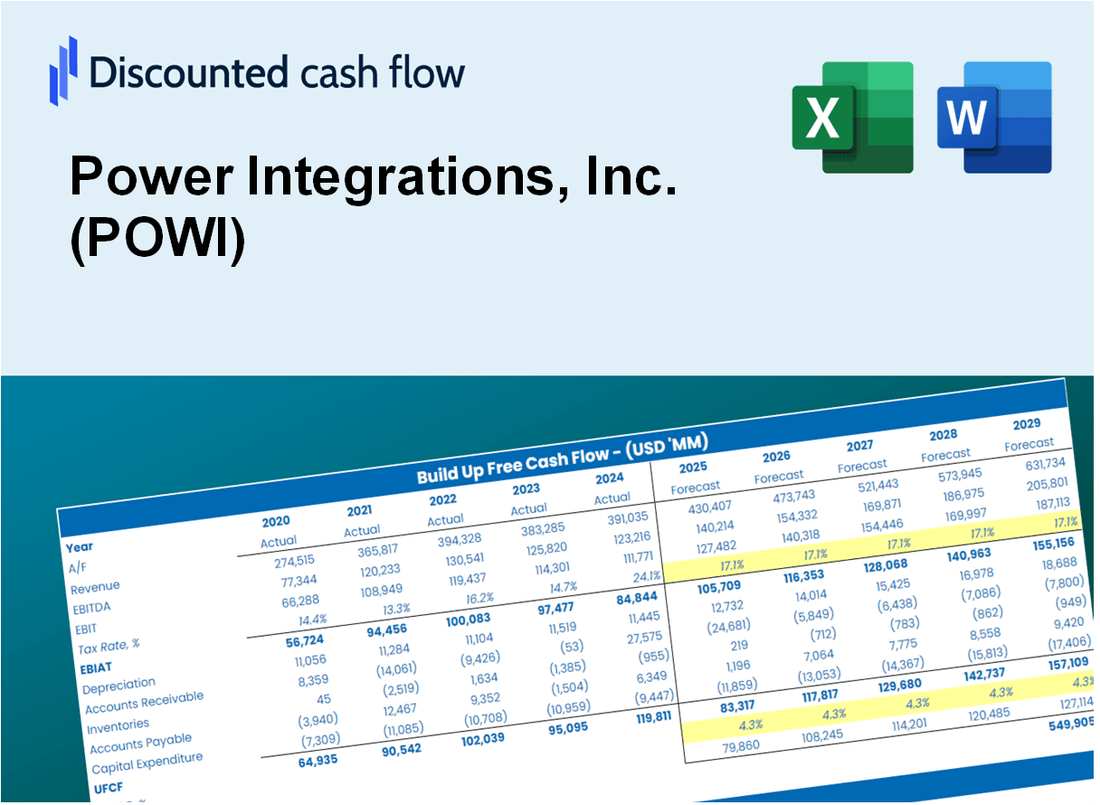
- Operating and Balance Sheet Data: Pre-filled Power Integrations historical data and forecasts, including revenue, EBITDA, EBIT, and capital expenditures.
- WACC Calculation: A dedicated sheet for Weighted Average Cost of Capital (WACC), including parameters like Beta, risk-free rate, and share price.
- DCF Valuation (Unlevered and Levered): Editable Discounted Cash Flow models showing intrinsic value with detailed calculations.
- Financial Statements: Pre-loaded financial statements (annual and quarterly) to support analysis.
- Key Ratios: Includes profitability, leverage, and efficiency ratios for Power Integrations, Inc. (POWI).
- Dashboard and Charts: Visual summary of valuation outputs and assumptions to analyze results easily.
Disclaimer
All information, articles, and product details provided on this website are for general informational and educational purposes only. We do not claim any ownership over, nor do we intend to infringe upon, any trademarks, copyrights, logos, brand names, or other intellectual property mentioned or depicted on this site. Such intellectual property remains the property of its respective owners, and any references here are made solely for identification or informational purposes, without implying any affiliation, endorsement, or partnership.
We make no representations or warranties, express or implied, regarding the accuracy, completeness, or suitability of any content or products presented. Nothing on this website should be construed as legal, tax, investment, financial, medical, or other professional advice. In addition, no part of this site—including articles or product references—constitutes a solicitation, recommendation, endorsement, advertisement, or offer to buy or sell any securities, franchises, or other financial instruments, particularly in jurisdictions where such activity would be unlawful.
All content is of a general nature and may not address the specific circumstances of any individual or entity. It is not a substitute for professional advice or services. Any actions you take based on the information provided here are strictly at your own risk. You accept full responsibility for any decisions or outcomes arising from your use of this website and agree to release us from any liability in connection with your use of, or reliance upon, the content or products found herein.