
|
PTC Industries Limited (PTCIL.NS) تقييم DCF |
Fully Editable: Tailor To Your Needs In Excel Or Sheets
Professional Design: Trusted, Industry-Standard Templates
Investor-Approved Valuation Models
MAC/PC Compatible, Fully Unlocked
No Expertise Is Needed; Easy To Follow
PTC Industries Limited (PTCIL.NS) Bundle
استكشف الإمكانات المالية لـ PTC Industries Limited (PTCILNS) مع حاسبة DCF سهلة الاستخدام! أدخل تقديراتك للنمو ، هوامش الربح ، ونفقات حساب القيمة الجوهرية لـ PTC Industries Limited (PTCILNS) وتعزيز نهج الاستثمار الخاص بك.
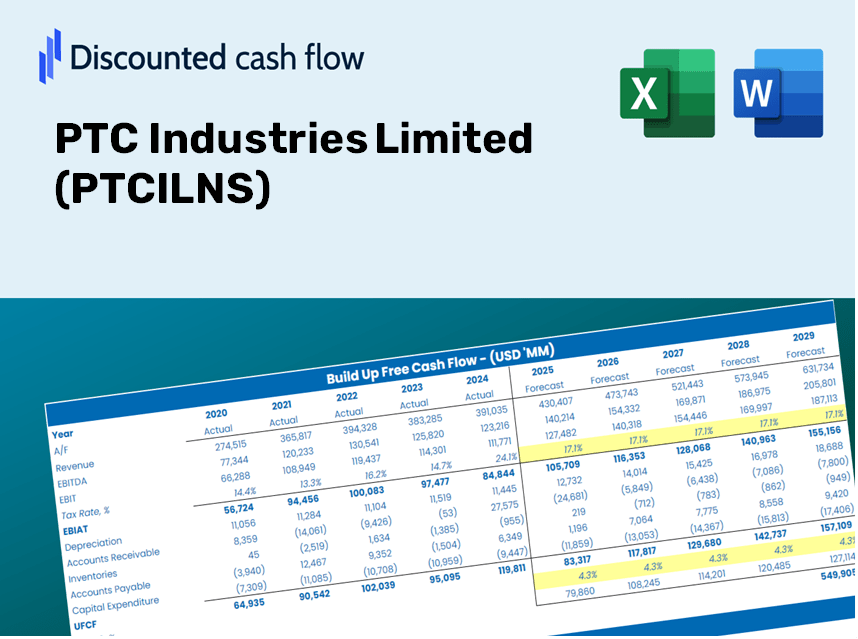
Discounted Cash Flow (DCF) - (USD MM)
| Year | AY1 2021 |
AY2 2022 |
AY3 2023 |
AY4 2024 |
AY5 2025 |
FY1 2026 |
FY2 2027 |
FY3 2028 |
FY4 2029 |
FY5 2030 |
|---|---|---|---|---|---|---|---|---|---|---|
| Revenue | 1,633.5 | 1,795.1 | 2,193.0 | 2,568.8 | 3,080.7 | 3,613.1 | 4,237.5 | 4,969.8 | 5,828.6 | 6,835.9 |
| Revenue Growth, % | 0 | 9.89 | 22.17 | 17.14 | 19.93 | 17.28 | 17.28 | 17.28 | 17.28 | 17.28 |
| EBITDA | 363.6 | 434.6 | 596.1 | 737.9 | 731.2 | 911.3 | 1,068.8 | 1,253.5 | 1,470.1 | 1,724.2 |
| EBITDA, % | 22.26 | 24.21 | 27.18 | 28.73 | 23.73 | 25.22 | 25.22 | 25.22 | 25.22 | 25.22 |
| Depreciation | 142.2 | 144.3 | 164.6 | 164.6 | 183.1 | 264.5 | 310.2 | 363.8 | 426.6 | 500.3 |
| Depreciation, % | 8.7 | 8.04 | 7.5 | 6.41 | 5.94 | 7.32 | 7.32 | 7.32 | 7.32 | 7.32 |
| EBIT | 221.5 | 290.3 | 431.6 | 573.2 | 548.0 | 646.9 | 758.7 | 889.8 | 1,043.5 | 1,223.8 |
| EBIT, % | 13.56 | 16.17 | 19.68 | 22.32 | 17.79 | 17.9 | 17.9 | 17.9 | 17.9 | 17.9 |
| Total Cash | 43.0 | 36.3 | 293.2 | 1,878.7 | 3,819.3 | 1,381.4 | 1,620.1 | 1,900.1 | 2,228.4 | 2,613.5 |
| Total Cash, percent | .0 | .0 | .0 | .0 | .0 | .0 | .0 | .0 | .0 | .0 |
| Account Receivables | 715.3 | 668.8 | 689.6 | 1,108.6 | 1,443.6 | 1,463.4 | 1,716.3 | 2,012.9 | 2,360.7 | 2,768.7 |
| Account Receivables, % | 43.79 | 37.26 | 31.45 | 43.16 | 46.86 | 40.5 | 40.5 | 40.5 | 40.5 | 40.5 |
| Inventories | 522.6 | 648.1 | 777.2 | 744.8 | 2,081.6 | 1,446.0 | 1,695.9 | 1,988.9 | 2,332.6 | 2,735.7 |
| Inventories, % | 31.99 | 36.1 | 35.44 | 28.99 | 67.57 | 40.02 | 40.02 | 40.02 | 40.02 | 40.02 |
| Accounts Payable | 269.6 | 187.4 | 210.4 | 154.0 | 487.2 | 421.6 | 494.5 | 580.0 | 680.2 | 797.7 |
| Accounts Payable, % | 16.51 | 10.44 | 9.59 | 5.99 | 15.82 | 11.67 | 11.67 | 11.67 | 11.67 | 11.67 |
| Capital Expenditure | -258.7 | -281.9 | -962.2 | -1,165.3 | -1,899.8 | -1,318.4 | -1,546.3 | -1,813.5 | -2,126.9 | -2,494.4 |
| Capital Expenditure, % | -15.84 | -15.7 | -43.88 | -45.36 | -61.67 | -36.49 | -36.49 | -36.49 | -36.49 | -36.49 |
| Tax Rate, % | 22.05 | 22.05 | 22.05 | 22.05 | 22.05 | 22.05 | 22.05 | 22.05 | 22.05 | 22.05 |
| EBITAT | 78.5 | 218.6 | 331.0 | 446.9 | 427.2 | 444.2 | 520.9 | 611.0 | 716.5 | 840.4 |
| Depreciation | ||||||||||
| Changes in Account Receivables | ||||||||||
| Changes in Inventories | ||||||||||
| Changes in Accounts Payable | ||||||||||
| Capital Expenditure | ||||||||||
| UFCF | -1,006.4 | -80.3 | -593.6 | -996.6 | -2,628.1 | -59.5 | -1,145.1 | -1,343.0 | -1,575.0 | -1,847.2 |
| WACC, % | 4.69 | 4.7 | 4.7 | 4.7 | 4.7 | 4.7 | 4.7 | 4.7 | 4.7 | 4.7 |
| PV UFCF | ||||||||||
| SUM PV UFCF | -5,051.0 | |||||||||
| Long Term Growth Rate, % | 2.00 | |||||||||
| Free cash flow (T + 1) | -1,884 | |||||||||
| Terminal Value | -69,874 | |||||||||
| Present Terminal Value | -55,546 | |||||||||
| Enterprise Value | -60,597 | |||||||||
| Net Debt | -3,210 | |||||||||
| Equity Value | -57,387 | |||||||||
| Diluted Shares Outstanding, MM | 15 | |||||||||
| Equity Value Per Share | -3,827.59 |
فوائد اختيار PTC Industries Limited (PTCILNS)
- البيانات المالية PTCILNS دقيقة: الوصول إلى كل من البيانات التاريخية والمتوقعة للتقييم الدقيق.
- المتغيرات القابلة للتخصيص: اضبط WACC ومعدلات الضرائب ونمو الإيرادات والنفقات الرأسمالية حسب الحاجة.
- الحسابات في الوقت الحقيقي: يحسب تلقائيًا القيمة الجوهرية و NPV لراحتك.
- تخطيط السيناريو: تحليل السيناريوهات المختلفة لتقييم آفاق الصناعات PTC المستقبلية.
- تصميم سهل الاستخدام: مصمم لخبراء الصناعة مع بقاء ودودين للقادمين الجدد.
الميزات الرئيسية
- 🔍 بيانات PTCILNS المالية الواقعية: البيانات التاريخية والمتوقعة المليئة مسبقًا بـ PTC Industries Limited.
- ✏️ مدخلات قابلة للتخصيص بالكامل: تعديل جميع المعلمات الأساسية (الخلايا الصفراء) مثل WACC و Growth ٪ ومعدلات الضرائب.
- 📊 تقييم DCF المهني: تقييم الصيغ المتكاملة القيمة الجوهرية لـ PTC Industries باستخدام طريقة التدفق النقدي المخفض.
- ⚡ النتائج الفورية: تصور على الفور تقييم PTC Industries بعد ضبط المدخلات.
- تحليل السيناريو: تقييم ومقارنة مختلف الافتراضات المالية جنبًا إلى جنب.
كيف تعمل
- الخطوة 1: قم بتنزيل ملف Excel لـ PTC Industries Limited (PTCILNS).
- الخطوة 2: فحص البيانات المالية المملوءة مسبقًا والتوقعات لصناعات PTC.
- الخطوة 3: ضبط المدخلات الرئيسية مثل نمو الإيرادات ، WACC ، ومعدلات الضرائب (الخلايا المميزة).
- الخطوة 4: راقب تحديث نموذج DCF في الوقت الفعلي أثناء تعديل افتراضاتك.
- الخطوة 5: تقييم المخرجات لإبلاغ قراراتك الاستثمارية الخاصة بـ PTC Industries Limited (PTCILNS).
لماذا تختار هذه الآلة الحاسبة؟
- حل الكل في واحد: يدمج تحليلات DCF و WACC ونسبة النسبة المالية للتقييمات الشاملة.
- مدخلات مرنة: تعديل الخلايا ذات الضوء الصفراء لاستكشاف سيناريوهات مختلفة.
- تحليل متعمق: يحدد تلقائيًا القيمة الجوهرية لـ PTC Industries Limited (PTCILNS) والقيمة الحالية الصافية.
- بيانات جاهزة للاستخدام: يأتي مع بيانات تاريخية ومتوقعة لتوفير نقاط انطلاق دقيقة.
- أداة من النوع العالي: مثالي للمحللين الماليين والمستثمرين ومستشاري الأعمال.
من يمكنه الاستفادة من هذا المنتج؟
- المستثمرون: تقييم بدقة القيمة العادلة لـ PTC Industries Limited (PTCILNS) قبل اتخاذ خيارات الاستثمار.
- المدير المالي: الاستفادة من نموذج DCF من الدرجة المهنية لتقارير وتحليل مالي شامل.
- الاستشاريون: تخصيص القالب لتقارير التقييم بسلاسة للعملاء.
- رواد الأعمال: اكتساب رؤى حول ممارسات النمذجة المالية التي تستخدمها الشركات الرائدة.
- المعلمون: تنفيذها كمورد تعليمي لتوضيح منهجيات التقييم المختلفة.
محتويات النموذج
- البيانات المعبأة مسبقًا: يحتوي على البيانات والتوقعات المالية التاريخية لشركة PTC Industries Limited.
- نموذج التدفق النقدي المخفض: نموذج تقييم DCF قابل للتحرير مع حسابات آلية.
- المتوسط المرجح لتكلفة رأس المال (WACC): ورقة محددة لحساب WACC باستخدام مدخلات مخصصة.
- النسب المالية الرئيسية: قم بتقييم ربحية PTC Industries Limited وكفاءة التشغيل والرافعة المالية.
- المدخلات القابلة للتخصيص: تعديل نمو الإيرادات وهوامش الربح ومعدلات الضرائب بسهولة.
- لوحة القيادة سهلة الاستخدام: مخططات وجداول مرئية تسلط الضوء على نتائج التقييم الأساسية.
Disclaimer
All information, articles, and product details provided on this website are for general informational and educational purposes only. We do not claim any ownership over, nor do we intend to infringe upon, any trademarks, copyrights, logos, brand names, or other intellectual property mentioned or depicted on this site. Such intellectual property remains the property of its respective owners, and any references here are made solely for identification or informational purposes, without implying any affiliation, endorsement, or partnership.
We make no representations or warranties, express or implied, regarding the accuracy, completeness, or suitability of any content or products presented. Nothing on this website should be construed as legal, tax, investment, financial, medical, or other professional advice. In addition, no part of this site—including articles or product references—constitutes a solicitation, recommendation, endorsement, advertisement, or offer to buy or sell any securities, franchises, or other financial instruments, particularly in jurisdictions where such activity would be unlawful.
All content is of a general nature and may not address the specific circumstances of any individual or entity. It is not a substitute for professional advice or services. Any actions you take based on the information provided here are strictly at your own risk. You accept full responsibility for any decisions or outcomes arising from your use of this website and agree to release us from any liability in connection with your use of, or reliance upon, the content or products found herein.