
|
PTC Industries Limited (PTCIL.NS) Avaliação DCF |
Totalmente Editável: Adapte-Se Às Suas Necessidades No Excel Ou Planilhas
Design Profissional: Modelos Confiáveis E Padrão Da Indústria
Pré-Construídos Para Uso Rápido E Eficiente
Compatível com MAC/PC, totalmente desbloqueado
Não É Necessária Experiência; Fácil De Seguir
PTC Industries Limited (PTCIL.NS) Bundle
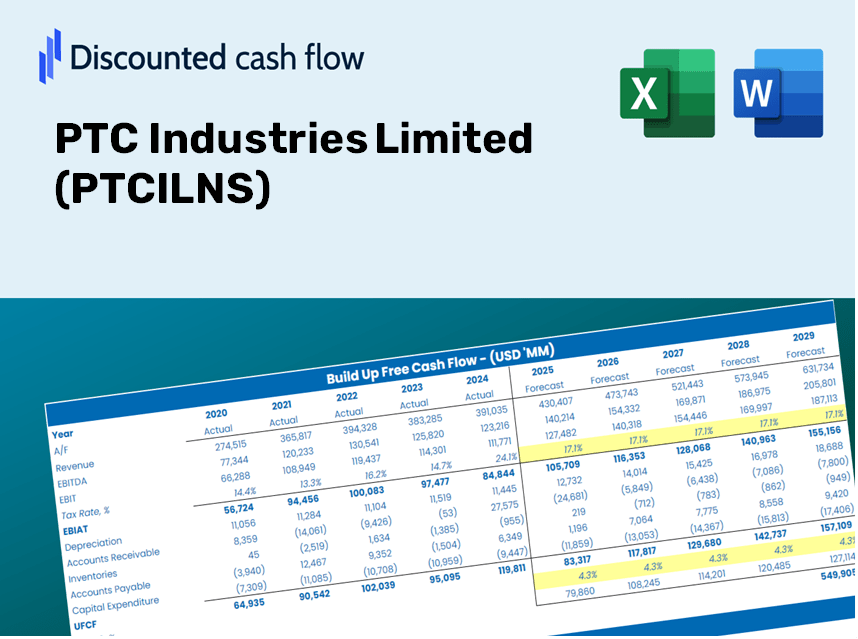
Explore o potencial financeiro da PTC Industries Limited (PTCILNS) com nossa calculadora DCF amigável! Digite suas estimativas de crescimento, margens de lucro e despesas para calcular o valor intrínseco da PTC Industries Limited (PTCILNS) e aprimore sua abordagem de investimento.
Discounted Cash Flow (DCF) - (USD MM)
| Year | AY1 2019 |
AY2 2020 |
AY3 2021 |
AY4 2022 |
AY5 2023 |
FY1 2024 |
FY2 2025 |
FY3 2026 |
FY4 2027 |
FY5 2028 |
|---|---|---|---|---|---|---|---|---|---|---|
| Revenue | 1,603.2 | 1,633.5 | 1,763.5 | 2,192.6 | 2,568.8 | 2,898.5 | 3,270.5 | 3,690.3 | 4,164.0 | 4,698.4 |
| Revenue Growth, % | 0 | 1.89 | 7.96 | 24.33 | 17.16 | 12.84 | 12.84 | 12.84 | 12.84 | 12.84 |
| EBITDA | 355.0 | 400.8 | 468.0 | 660.7 | 859.5 | 793.1 | 894.9 | 1,009.7 | 1,139.3 | 1,285.6 |
| EBITDA, % | 22.14 | 24.53 | 26.54 | 30.13 | 33.46 | 27.36 | 27.36 | 27.36 | 27.36 | 27.36 |
| Depreciation | 102.1 | 143.5 | 146.2 | 166.3 | 166.3 | 217.4 | 245.3 | 276.8 | 312.3 | 352.4 |
| Depreciation, % | 6.37 | 8.79 | 8.29 | 7.59 | 6.47 | 7.5 | 7.5 | 7.5 | 7.5 | 7.5 |
| EBIT | 252.9 | 257.3 | 321.8 | 494.4 | 693.2 | 575.7 | 649.5 | 732.9 | 827.0 | 933.1 |
| EBIT, % | 15.77 | 15.75 | 18.25 | 22.55 | 26.98 | 19.86 | 19.86 | 19.86 | 19.86 | 19.86 |
| Total Cash | 82.3 | 78.5 | 42.1 | 319.9 | 1,878.7 | 580.0 | 654.4 | 738.4 | 833.2 | 940.2 |
| Total Cash, percent | .0 | .0 | .0 | .0 | .0 | .0 | .0 | .0 | .0 | .0 |
| Account Receivables | 439.7 | 633.0 | 668.8 | 689.6 | 1,108.6 | 1,036.0 | 1,168.9 | 1,318.9 | 1,488.2 | 1,679.3 |
| Account Receivables, % | 27.43 | 38.75 | 37.92 | 31.45 | 43.16 | 35.74 | 35.74 | 35.74 | 35.74 | 35.74 |
| Inventories | 520.9 | 522.6 | 648.1 | 777.2 | 744.8 | 960.4 | 1,083.7 | 1,222.8 | 1,379.7 | 1,556.8 |
| Inventories, % | 32.49 | 31.99 | 36.75 | 35.45 | 28.99 | 33.13 | 33.13 | 33.13 | 33.13 | 33.13 |
| Accounts Payable | 273.6 | 269.6 | 187.4 | 210.4 | 154.0 | 346.6 | 391.1 | 441.3 | 497.9 | 561.8 |
| Accounts Payable, % | 17.06 | 16.51 | 10.63 | 9.59 | 5.99 | 11.96 | 11.96 | 11.96 | 11.96 | 11.96 |
| Capital Expenditure | -155.0 | -258.7 | -281.9 | -962.2 | -1,165.3 | -757.9 | -855.1 | -964.9 | -1,088.7 | -1,228.5 |
| Capital Expenditure, % | -9.67 | -15.84 | -15.98 | -43.88 | -45.36 | -26.15 | -26.15 | -26.15 | -26.15 | -26.15 |
| Tax Rate, % | 22.04 | 22.04 | 22.04 | 22.04 | 22.04 | 22.04 | 22.04 | 22.04 | 22.04 | 22.04 |
| EBITAT | 191.2 | 91.1 | 242.3 | 379.2 | 540.4 | 392.6 | 442.9 | 499.8 | 563.9 | 636.3 |
| Depreciation | ||||||||||
| Changes in Account Receivables | ||||||||||
| Changes in Inventories | ||||||||||
| Changes in Accounts Payable | ||||||||||
| Capital Expenditure | ||||||||||
| UFCF | -548.7 | -222.9 | -137.0 | -543.7 | -901.5 | -98.3 | -378.6 | -427.2 | -482.1 | -543.9 |
| WACC, % | 5.2 | 5.17 | 5.2 | 5.2 | 5.2 | 5.19 | 5.19 | 5.19 | 5.19 | 5.19 |
| PV UFCF | ||||||||||
| SUM PV UFCF | -1,618.7 | |||||||||
| Long Term Growth Rate, % | 2.00 | |||||||||
| Free cash flow (T + 1) | -555 | |||||||||
| Terminal Value | -17,379 | |||||||||
| Present Terminal Value | -13,493 | |||||||||
| Enterprise Value | -15,111 | |||||||||
| Net Debt | 476 | |||||||||
| Equity Value | -15,587 | |||||||||
| Diluted Shares Outstanding, MM | 14 | |||||||||
| Equity Value Per Share | -1,120.59 |
Benefits of Choosing PTC Industries Limited (PTCILNS)
- Accurate PTCILNS Financials: Access to both historical and projected data for precise valuation.
- Customizable Variables: Adjust WACC, tax rates, revenue growth, and capital expenditures as needed.
- Real-Time Calculations: Automatically calculates intrinsic value and NPV for your convenience.
- Scenario Planning: Analyze various scenarios to assess PTC Industries' future prospects.
- User-Friendly Layout: Designed for industry experts while remaining approachable for newcomers.
Key Features
- 🔍 Real-Life PTCILNS Financials: Pre-filled historical and projected data for PTC Industries Limited.
- ✏️ Fully Customizable Inputs: Modify all essential parameters (yellow cells) such as WACC, growth %, and tax rates.
- 📊 Professional DCF Valuation: Integrated formulas assess PTC Industries' intrinsic value using the Discounted Cash Flow method.
- ⚡ Instant Results: Immediately visualize PTC Industries' valuation after adjusting inputs.
- Scenario Analysis: Evaluate and compare various financial assumptions side-by-side.
How It Functions
- Step 1: Download the Excel file for PTC Industries Limited (PTCILNS).
- Step 2: Examine the pre-filled financial data and projections for PTC Industries.
- Step 3: Adjust key inputs such as revenue growth, WACC, and tax rates (highlighted cells).
- Step 4: Observe the DCF model update in real-time as you modify your assumptions.
- Step 5: Evaluate the outputs to inform your investment decisions for PTC Industries Limited (PTCILNS).
Why Opt for This Calculator?
- All-in-One Solution: Integrates DCF, WACC, and financial ratio analyses for comprehensive assessments.
- Flexible Inputs: Modify the yellow-highlighted cells to explore different scenarios.
- In-Depth Analysis: Automatically determines PTC Industries Limited's (PTCILNS) intrinsic value and Net Present Value.
- Ready-to-Use Data: Comes with historical and projected data to provide accurate starting points.
- High-Caliber Tool: Perfect for financial analysts, investors, and business advisors.
Who Can Benefit from This Product?
- Investors: Accurately assess the fair value of PTC Industries Limited (PTCILNS) before making investment choices.
- CFOs: Utilize a professional-grade DCF model for comprehensive financial reporting and analysis.
- Consultants: Seamlessly customize the template for valuation reports tailored to clients.
- Entrepreneurs: Acquire insights into financial modeling practices employed by leading companies.
- Educators: Implement it as a teaching resource to illustrate various valuation methodologies.
Contents of the Template
- Pre-Filled Data: Contains PTC Industries Limited’s historical financial data and projections.
- Discounted Cash Flow Model: An editable DCF valuation model with automated calculations.
- Weighted Average Cost of Capital (WACC): A specific sheet for computing WACC using customized inputs.
- Key Financial Ratios: Evaluate PTC Industries Limited’s profitability, operational efficiency, and financial leverage.
- Customizable Inputs: Easily modify revenue growth, profit margins, and tax rates.
- User-Friendly Dashboard: Visual charts and tables highlighting essential valuation results.
Disclaimer
All information, articles, and product details provided on this website are for general informational and educational purposes only. We do not claim any ownership over, nor do we intend to infringe upon, any trademarks, copyrights, logos, brand names, or other intellectual property mentioned or depicted on this site. Such intellectual property remains the property of its respective owners, and any references here are made solely for identification or informational purposes, without implying any affiliation, endorsement, or partnership.
We make no representations or warranties, express or implied, regarding the accuracy, completeness, or suitability of any content or products presented. Nothing on this website should be construed as legal, tax, investment, financial, medical, or other professional advice. In addition, no part of this site—including articles or product references—constitutes a solicitation, recommendation, endorsement, advertisement, or offer to buy or sell any securities, franchises, or other financial instruments, particularly in jurisdictions where such activity would be unlawful.
All content is of a general nature and may not address the specific circumstances of any individual or entity. It is not a substitute for professional advice or services. Any actions you take based on the information provided here are strictly at your own risk. You accept full responsibility for any decisions or outcomes arising from your use of this website and agree to release us from any liability in connection with your use of, or reliance upon, the content or products found herein.