
|
Qurate Retail ، Inc. (QRTEA) تقييم DCF |
Fully Editable: Tailor To Your Needs In Excel Or Sheets
Professional Design: Trusted, Industry-Standard Templates
Investor-Approved Valuation Models
MAC/PC Compatible, Fully Unlocked
No Expertise Is Needed; Easy To Follow
Qurate Retail, Inc. (QRTEA) Bundle
تبسيط تقييم Qurate Retail ، Inc. (QRTEA) مع هذه الآلة الحاسبة DCF القابلة للتخصيص! يضم Deal Qurate Retail ، Inc. (QRTEA) والمدخلات المتوقعة القابلة للتعديل ، يمكنك اختبار السيناريوهات وكشف القيمة العادلة Qurate Retail ، Inc. (QRTEA) في دقائق.
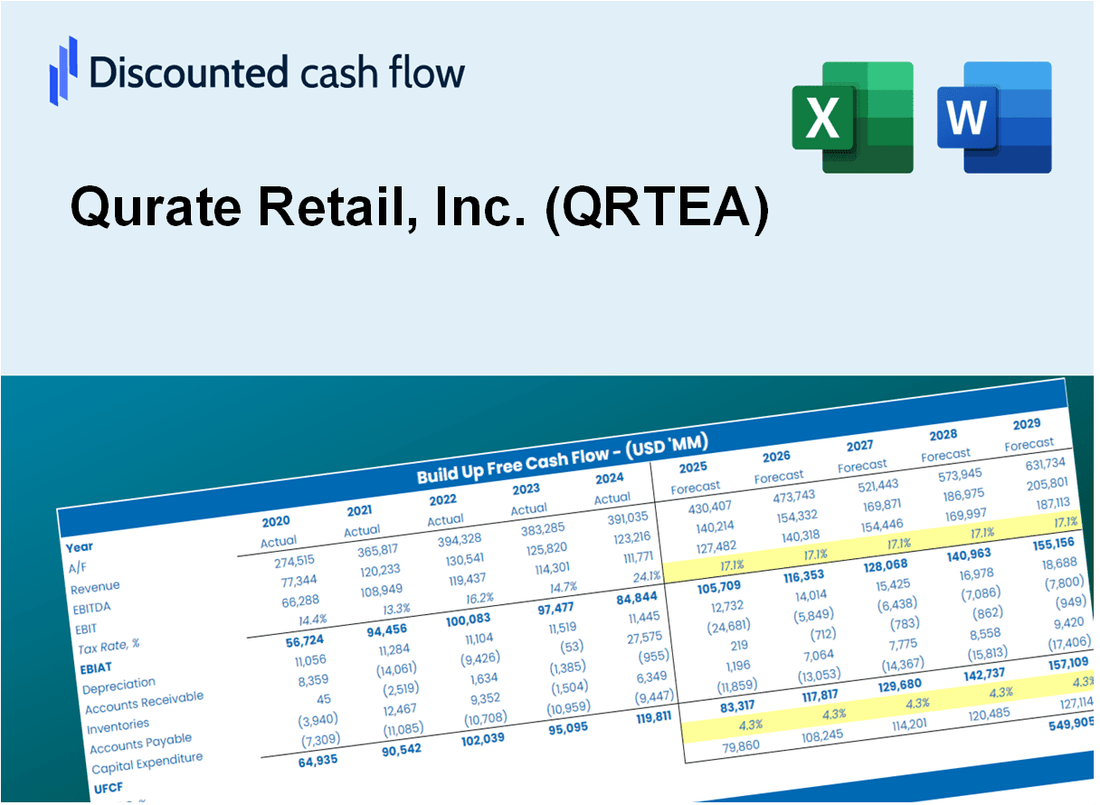
Discounted Cash Flow (DCF) - (USD MM)
| Year | AY1 2019 |
AY2 2020 |
AY3 2021 |
AY4 2022 |
AY5 2023 |
FY1 2024 |
FY2 2025 |
FY3 2026 |
FY4 2027 |
FY5 2028 |
|---|---|---|---|---|---|---|---|---|---|---|
| Revenue | 13,458.0 | 14,177.0 | 14,044.0 | 12,106.0 | 10,915.0 | 10,390.2 | 9,890.6 | 9,415.0 | 8,962.3 | 8,531.4 |
| Revenue Growth, % | 0 | 5.34 | -0.93814 | -13.8 | -9.84 | -4.81 | -4.81 | -4.81 | -4.81 | -4.81 |
| EBITDA | 358.0 | 2,134.0 | 1,987.0 | -1,371.0 | 924.0 | 602.7 | 573.7 | 546.1 | 519.8 | 494.8 |
| EBITDA, % | 2.66 | 15.05 | 14.15 | -11.32 | 8.47 | 5.8 | 5.8 | 5.8 | 5.8 | 5.8 |
| Depreciation | 606.0 | 562.0 | 537.0 | 481.0 | 407.0 | 415.5 | 395.5 | 376.5 | 358.4 | 341.1 |
| Depreciation, % | 4.5 | 3.96 | 3.82 | 3.97 | 3.73 | 4 | 4 | 4 | 4 | 4 |
| EBIT | -248.0 | 1,572.0 | 1,450.0 | -1,852.0 | 517.0 | 187.2 | 178.2 | 169.6 | 161.5 | 153.7 |
| EBIT, % | -1.84 | 11.09 | 10.32 | -15.3 | 4.74 | 1.8 | 1.8 | 1.8 | 1.8 | 1.8 |
| Total Cash | 673.0 | 806.0 | 587.0 | 1,275.0 | 1,121.0 | 741.2 | 705.6 | 671.6 | 639.3 | 608.6 |
| Total Cash, percent | .0 | .0 | .0 | .0 | .0 | .0 | .0 | .0 | .0 | .0 |
| Account Receivables | 1,854.0 | 1,985.0 | 2,003.0 | 1,444.0 | 1,308.0 | 1,370.5 | 1,304.6 | 1,241.9 | 1,182.2 | 1,125.3 |
| Account Receivables, % | 13.78 | 14 | 14.26 | 11.93 | 11.98 | 13.19 | 13.19 | 13.19 | 13.19 | 13.19 |
| Inventories | 1,413.0 | 1,301.0 | 1,623.0 | 1,346.0 | 1,044.0 | 1,078.8 | 1,027.0 | 977.6 | 930.6 | 885.8 |
| Inventories, % | 10.5 | 9.18 | 11.56 | 11.12 | 9.56 | 10.38 | 10.38 | 10.38 | 10.38 | 10.38 |
| Accounts Payable | 1,091.0 | 1,305.0 | 1,429.0 | 976.0 | 895.0 | 909.1 | 865.4 | 823.8 | 784.2 | 746.5 |
| Accounts Payable, % | 8.11 | 9.21 | 10.18 | 8.06 | 8.2 | 8.75 | 8.75 | 8.75 | 8.75 | 8.75 |
| Capital Expenditure | -459.0 | -313.0 | -431.0 | -313.0 | -343.0 | -299.6 | -285.2 | -271.4 | -258.4 | -246.0 |
| Capital Expenditure, % | -3.41 | -2.21 | -3.07 | -2.59 | -3.14 | -2.88 | -2.88 | -2.88 | -2.88 | -2.88 |
| Tax Rate, % | 319.7 | 319.7 | 319.7 | 319.7 | 319.7 | 319.7 | 319.7 | 319.7 | 319.7 | 319.7 |
| EBITAT | -161.5 | 1,788.9 | 772.7 | -2,031.7 | -1,135.8 | 119.2 | 113.5 | 108.0 | 102.8 | 97.9 |
| Depreciation | ||||||||||
| Changes in Account Receivables | ||||||||||
| Changes in Inventories | ||||||||||
| Changes in Accounts Payable | ||||||||||
| Capital Expenditure | ||||||||||
| UFCF | -2,190.5 | 2,232.9 | 662.7 | -1,480.7 | -714.8 | 151.9 | 297.9 | 283.5 | 269.9 | 256.9 |
| WACC, % | 4.28 | 6.41 | 3.56 | 6.41 | 0.3179 | 4.2 | 4.2 | 4.2 | 4.2 | 4.2 |
| PV UFCF | ||||||||||
| SUM PV UFCF | 1,109.0 | |||||||||
| Long Term Growth Rate, % | 2.00 | |||||||||
| Free cash flow (T + 1) | 262 | |||||||||
| Terminal Value | 11,937 | |||||||||
| Present Terminal Value | 9,720 | |||||||||
| Enterprise Value | 10,829 | |||||||||
| Net Debt | 6,130 | |||||||||
| Equity Value | 4,699 | |||||||||
| Diluted Shares Outstanding, MM | 388 | |||||||||
| Equity Value Per Share | 12.11 |
What You Will Get
- Real QRTEA Financial Data: Pre-filled with Qurate Retail’s historical and projected data for precise analysis.
- Fully Editable Template: Modify key inputs like revenue growth, WACC, and EBITDA % with ease.
- Automatic Calculations: See Qurate Retail’s intrinsic value update instantly based on your changes.
- Professional Valuation Tool: Designed for investors, analysts, and consultants seeking accurate DCF results.
- User-Friendly Design: Simple structure and clear instructions for all experience levels.
Key Features
- 🔍 Real-Life QRTEA Financials: Pre-filled historical and projected data for Qurate Retail, Inc.
- ✏️ Fully Customizable Inputs: Adjust all critical parameters (yellow cells) like WACC, growth %, and tax rates.
- 📊 Professional DCF Valuation: Built-in formulas calculate Qurate Retail’s intrinsic value using the Discounted Cash Flow method.
- ⚡ Instant Results: Visualize Qurate Retail’s valuation instantly after making changes.
- Scenario Analysis: Test and compare outcomes for various financial assumptions side-by-side.
How It Works
- 1. Access the Template: Download and open the Excel file containing Qurate Retail, Inc.'s (QRTEA) preloaded data.
- 2. Modify Assumptions: Adjust essential inputs such as growth rates, WACC, and capital expenditures.
- 3. View Results in Real-Time: The DCF model automatically computes intrinsic value and NPV.
- 4. Explore Scenarios: Analyze various forecasts to evaluate different valuation results.
- 5. Present with Assurance: Deliver professional valuation insights to back your strategic decisions.
Why Choose This Calculator for Qurate Retail, Inc. (QRTEA)?
- Accurate Data: Utilize real Qurate Retail financials for dependable valuation outcomes.
- Customizable: Modify essential parameters such as growth rates, WACC, and tax rates to align with your forecasts.
- Time-Saving: Pre-built calculations save you from starting from the ground up.
- Professional-Grade Tool: Tailored for investors, analysts, and consultants in the retail sector.
- User-Friendly: An intuitive design and step-by-step guidance ensure ease of use for everyone.
Who Should Use This Product?
- Professional Investors: Develop comprehensive and accurate valuation models for assessing Qurate Retail, Inc. (QRTEA) investments.
- Corporate Finance Teams: Evaluate valuation scenarios to inform strategic decisions within the organization.
- Consultants and Advisors: Deliver precise valuation insights to clients considering Qurate Retail, Inc. (QRTEA) stock.
- Students and Educators: Utilize real market data to enhance learning and practice in financial modeling.
- Retail Industry Analysts: Gain insights into how companies like Qurate Retail, Inc. (QRTEA) are valued in the retail sector.
What the Template Contains
- Pre-Filled DCF Model: Qurate Retail, Inc.’s (QRTEA) financial data preloaded for immediate use.
- WACC Calculator: Detailed calculations for Weighted Average Cost of Capital specific to Qurate Retail, Inc. (QRTEA).
- Financial Ratios: Evaluate Qurate Retail, Inc.’s (QRTEA) profitability, leverage, and efficiency.
- Editable Inputs: Change assumptions such as growth, margins, and CAPEX to fit your scenarios for Qurate Retail, Inc. (QRTEA).
- Financial Statements: Annual and quarterly reports for Qurate Retail, Inc. (QRTEA) to support detailed analysis.
- Interactive Dashboard: Easily visualize key valuation metrics and results for Qurate Retail, Inc. (QRTEA).
Disclaimer
All information, articles, and product details provided on this website are for general informational and educational purposes only. We do not claim any ownership over, nor do we intend to infringe upon, any trademarks, copyrights, logos, brand names, or other intellectual property mentioned or depicted on this site. Such intellectual property remains the property of its respective owners, and any references here are made solely for identification or informational purposes, without implying any affiliation, endorsement, or partnership.
We make no representations or warranties, express or implied, regarding the accuracy, completeness, or suitability of any content or products presented. Nothing on this website should be construed as legal, tax, investment, financial, medical, or other professional advice. In addition, no part of this site—including articles or product references—constitutes a solicitation, recommendation, endorsement, advertisement, or offer to buy or sell any securities, franchises, or other financial instruments, particularly in jurisdictions where such activity would be unlawful.
All content is of a general nature and may not address the specific circumstances of any individual or entity. It is not a substitute for professional advice or services. Any actions you take based on the information provided here are strictly at your own risk. You accept full responsibility for any decisions or outcomes arising from your use of this website and agree to release us from any liability in connection with your use of, or reliance upon, the content or products found herein.