
|
Rush Enterprises ، Inc. (RushB) DCF تقييم |
Fully Editable: Tailor To Your Needs In Excel Or Sheets
Professional Design: Trusted, Industry-Standard Templates
Investor-Approved Valuation Models
MAC/PC Compatible, Fully Unlocked
No Expertise Is Needed; Easy To Follow
Rush Enterprises, Inc. (RUSHB) Bundle
احصل على فهم شامل لتحليل تقييم Rush Enterprises ، Inc. (RushB) باستخدام حاسبة DCF الحديثة الخاصة بنا! يتيح لك هذا القالب في الوقت الفعلي (RushB) ، هذا القالب Excel ضبط التوقعات والافتراضات لتحديد القيمة الجوهرية لـ Rush Enterprises ، Inc بدقة.
What You Will Get
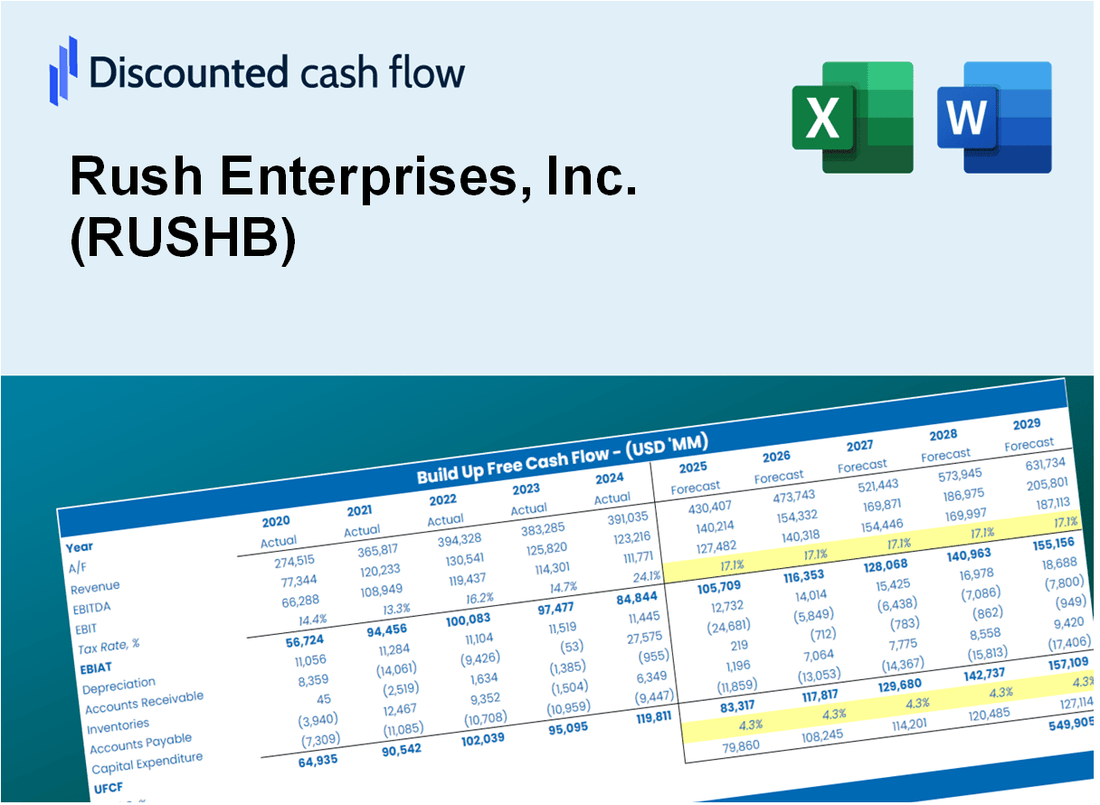
- Real Rush Enterprises Data: Preloaded financials – from revenue to EBIT – based on actual and projected figures.
- Full Customization: Adjust all critical parameters (yellow cells) like WACC, growth %, and tax rates.
- Instant Valuation Updates: Automatic recalculations to analyze the impact of changes on Rush Enterprises’ fair value.
- Versatile Excel Template: Tailored for quick edits, scenario testing, and detailed projections.
- Time-Saving and Accurate: Skip building models from scratch while maintaining precision and flexibility.
Key Features
- Comprehensive DCF Calculator: Features detailed unlevered and levered DCF valuation models tailored for Rush Enterprises, Inc. (RUSHB).
- WACC Calculator: Pre-configured Weighted Average Cost of Capital sheet with adjustable inputs specific to Rush Enterprises, Inc. (RUSHB).
- Customizable Forecast Assumptions: Adjust growth rates, capital expenditures, and discount rates to fit Rush Enterprises, Inc. (RUSHB) scenarios.
- Integrated Financial Ratios: Evaluate profitability, leverage, and efficiency ratios for Rush Enterprises, Inc. (RUSHB).
- Visual Dashboard and Charts: Graphical outputs present key valuation metrics for straightforward analysis of Rush Enterprises, Inc. (RUSHB).
How It Works
- 1. Access the Template: Download and open the Excel file featuring Rush Enterprises, Inc.'s preloaded data.
- 2. Modify Assumptions: Adjust critical inputs such as growth rates, WACC, and capital expenditures.
- 3. View Results Instantly: The DCF model automatically calculates the intrinsic value and NPV.
- 4. Explore Scenarios: Analyze various forecasts to evaluate different valuation results.
- 5. Present with Confidence: Share professional valuation insights to inform your strategic decisions.
Why Choose Rush Enterprises, Inc. (RUSHB)?
- Streamlined Operations: Benefit from our efficient processes that save you time and resources.
- Enhanced Reliability: Our robust financial metrics ensure accurate assessments and decisions.
- Fully Adaptable: Customize our services to meet your specific business needs and goals.
- User-Friendly Experience: Intuitive interfaces and clear data presentation facilitate easy understanding.
- Preferred by Industry Leaders: Trusted by professionals who prioritize excellence and effectiveness.
Who Should Use This Product?
- Finance Students: Explore industry-specific valuation methods and apply them to real-world data.
- Academics: Integrate advanced financial models into your teaching or research on Rush Enterprises, Inc. (RUSHB).
- Investors: Validate your investment strategies and evaluate valuation metrics for Rush Enterprises, Inc. (RUSHB).
- Analysts: Enhance your analysis process with a ready-to-use, customizable DCF model tailored for Rush Enterprises, Inc. (RUSHB).
- Small Business Owners: Learn how public companies like Rush Enterprises, Inc. (RUSHB) are valued and analyzed.
What the Template Contains
- Pre-Filled Data: Includes Rush Enterprises’ historical financials and forecasts.
- Discounted Cash Flow Model: Editable DCF valuation model with automatic calculations.
- Weighted Average Cost of Capital (WACC): A dedicated sheet for calculating WACC based on custom inputs.
- Key Financial Ratios: Analyze Rush Enterprises’ profitability, efficiency, and leverage.
- Customizable Inputs: Edit revenue growth, margins, and tax rates with ease.
- Clear Dashboard: Charts and tables summarizing key valuation results.
Disclaimer
All information, articles, and product details provided on this website are for general informational and educational purposes only. We do not claim any ownership over, nor do we intend to infringe upon, any trademarks, copyrights, logos, brand names, or other intellectual property mentioned or depicted on this site. Such intellectual property remains the property of its respective owners, and any references here are made solely for identification or informational purposes, without implying any affiliation, endorsement, or partnership.
We make no representations or warranties, express or implied, regarding the accuracy, completeness, or suitability of any content or products presented. Nothing on this website should be construed as legal, tax, investment, financial, medical, or other professional advice. In addition, no part of this site—including articles or product references—constitutes a solicitation, recommendation, endorsement, advertisement, or offer to buy or sell any securities, franchises, or other financial instruments, particularly in jurisdictions where such activity would be unlawful.
All content is of a general nature and may not address the specific circumstances of any individual or entity. It is not a substitute for professional advice or services. Any actions you take based on the information provided here are strictly at your own risk. You accept full responsibility for any decisions or outcomes arising from your use of this website and agree to release us from any liability in connection with your use of, or reliance upon, the content or products found herein.