
|
Sanofi India Limited (Sanofi.ns) تقييم DCF |
Fully Editable: Tailor To Your Needs In Excel Or Sheets
Professional Design: Trusted, Industry-Standard Templates
Investor-Approved Valuation Models
MAC/PC Compatible, Fully Unlocked
No Expertise Is Needed; Easy To Follow
Sanofi India Limited (SANOFI.NS) Bundle
تقييم التوقعات المالية لـ Sanofi India محدودة مثل خبير! توفر حاسبة DCF هذه (Sanofins) بيانات مالية مليئة مسبقًا ومرونة كاملة لتعديل نمو الإيرادات ، WACC ، الهوامش ، وغيرها من الافتراضات الحاسمة التي تتماشى مع تنبؤاتك.
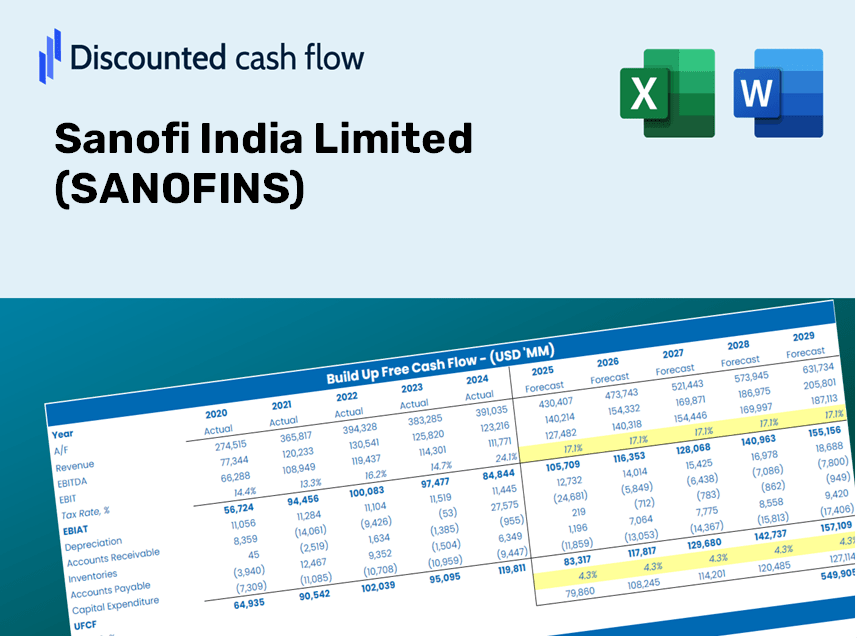
Discounted Cash Flow (DCF) - (USD MM)
| Year | AY1 2020 |
AY2 2021 |
AY3 2022 |
AY4 2023 |
AY5 2024 |
FY1 2025 |
FY2 2026 |
FY3 2027 |
FY4 2028 |
FY5 2029 |
|---|---|---|---|---|---|---|---|---|---|---|
| Revenue | 29,019.0 | 29,566.0 | 27,701.0 | 19,961.0 | 20,132.0 | 18,546.2 | 17,085.4 | 15,739.6 | 14,499.8 | 13,357.7 |
| Revenue Growth, % | 0 | 1.88 | -6.31 | -27.94 | 0.85667 | -7.88 | -7.88 | -7.88 | -7.88 | -7.88 |
| EBITDA | 7,091.0 | 7,537.0 | 6,984.0 | 4,847.0 | 4,852.0 | 4,581.8 | 4,220.9 | 3,888.4 | 3,582.1 | 3,300.0 |
| EBITDA, % | 24.44 | 25.49 | 25.21 | 24.28 | 24.1 | 24.7 | 24.7 | 24.7 | 24.7 | 24.7 |
| Depreciation | 753.0 | 578.0 | 326.0 | 312.0 | 313.0 | 328.1 | 302.2 | 278.4 | 256.5 | 236.3 |
| Depreciation, % | 2.59 | 1.95 | 1.18 | 1.56 | 1.55 | 1.77 | 1.77 | 1.77 | 1.77 | 1.77 |
| EBIT | 6,338.0 | 6,959.0 | 6,658.0 | 4,535.0 | 4,539.0 | 4,253.7 | 3,918.7 | 3,610.0 | 3,325.6 | 3,063.7 |
| EBIT, % | 21.84 | 23.54 | 24.04 | 22.72 | 22.55 | 22.94 | 22.94 | 22.94 | 22.94 | 22.94 |
| Total Cash | 11,974.0 | 15,380.0 | 10,049.0 | 3,945.0 | 3,400.0 | 6,165.2 | 5,679.5 | 5,232.2 | 4,820.0 | 4,440.4 |
| Total Cash, percent | .0 | .0 | .0 | .0 | .0 | .0 | .0 | .0 | .0 | .0 |
| Account Receivables | 1,921.0 | 1,537.0 | 1,372.0 | 1,410.0 | 2,765.0 | 1,393.5 | 1,283.8 | 1,182.7 | 1,089.5 | 1,003.7 |
| Account Receivables, % | 6.62 | 5.2 | 4.95 | 7.06 | 13.73 | 7.51 | 7.51 | 7.51 | 7.51 | 7.51 |
| Inventories | 3,680.0 | 3,924.0 | 4,080.0 | 6,638.0 | 4,998.0 | 3,663.4 | 3,374.8 | 3,109.0 | 2,864.1 | 2,638.5 |
| Inventories, % | 12.68 | 13.27 | 14.73 | 33.25 | 24.83 | 19.75 | 19.75 | 19.75 | 19.75 | 19.75 |
| Accounts Payable | 3,183.0 | 3,767.0 | 3,564.0 | 2,915.0 | 4,063.0 | 2,647.0 | 2,438.5 | 2,246.4 | 2,069.4 | 1,906.4 |
| Accounts Payable, % | 10.97 | 12.74 | 12.87 | 14.6 | 20.18 | 14.27 | 14.27 | 14.27 | 14.27 | 14.27 |
| Capital Expenditure | -414.0 | -230.0 | -222.0 | -343.0 | -364.0 | -242.3 | -223.2 | -205.6 | -189.4 | -174.5 |
| Capital Expenditure, % | -1.43 | -0.77792 | -0.80142 | -1.72 | -1.81 | -1.31 | -1.31 | -1.31 | -1.31 | -1.31 |
| Tax Rate, % | 4.2 | 4.2 | 4.2 | 4.2 | 4.2 | 4.2 | 4.2 | 4.2 | 4.2 | 4.2 |
| EBITAT | 4,469.9 | 5,225.9 | 4,780.7 | 5,173.4 | 4,348.6 | 3,515.5 | 3,238.6 | 2,983.5 | 2,748.5 | 2,532.0 |
| Depreciation | ||||||||||
| Changes in Account Receivables | ||||||||||
| Changes in Inventories | ||||||||||
| Changes in Accounts Payable | ||||||||||
| Capital Expenditure | ||||||||||
| UFCF | 2,390.9 | 6,297.9 | 4,690.7 | 1,897.4 | 5,730.6 | 4,891.3 | 3,507.4 | 3,231.2 | 2,976.6 | 2,742.2 |
| WACC, % | 4.54 | 4.54 | 4.54 | 4.54 | 4.54 | 4.54 | 4.54 | 4.54 | 4.54 | 4.54 |
| PV UFCF | ||||||||||
| SUM PV UFCF | 15,406.1 | |||||||||
| Long Term Growth Rate, % | 3.00 | |||||||||
| Free cash flow (T + 1) | 2,824 | |||||||||
| Terminal Value | 183,718 | |||||||||
| Present Terminal Value | 147,162 | |||||||||
| Enterprise Value | 162,568 | |||||||||
| Net Debt | -2,645 | |||||||||
| Equity Value | 165,213 | |||||||||
| Diluted Shares Outstanding, MM | 23 | |||||||||
| Equity Value Per Share | 7,173.61 |
فوائد اختيار Sanofi India Limited (Sanofins)
- بيانات Sanofins دقيقة: الوصول إلى كل من البيانات التاريخية والمتوقعة للتقييم الدقيق.
- المعلمات القابلة للتخصيص: اضبط WACC ، ومعدلات الضرائب ، ونمو الإيرادات ، والنفقات الرأسمالية لتناسب تحليلك.
- الحسابات الديناميكية: الحساب الآلي للقيمة الجوهرية و NPV في الوقت الحقيقي.
- أداة تحليل السيناريو: تقييم السيناريوهات المختلفة للتنبؤ بأداء سانوفي الهند في المستقبل.
- واجهة سهلة الاستخدام: تم تصميمه للمهنيين في هذا المجال مع بقاء سهلة التنقل للقادمين الجدد.
الميزات الرئيسية لسانوفي الهند المحدودة (Sanofins)
- متغيرات التنبؤ القابلة للتخصيص: اضبط المدخلات الأساسية مثل معدلات نمو الإيرادات ، والنسب المئوية للـ EBITDA ، والنفقات الرأسمالية.
- تقييم DCF الفوري: يحسب بسرعة القيمة الجوهرية ، صافي القيمة الحالية (NPV) ، والمقاييس المالية الإضافية.
- دقة عالية الدقة: يعزز البيانات المالية الفعلية لـ Sanofi India Limited لنتائج التقييم الموثوقة.
- تحليل سيناريو مبسط: استكشاف مختلف الافتراضات وتقييم آثارها.
- داعم الكفاءة: تجنب تعقيدات إنشاء نماذج تقييم معقدة من الألف إلى الياء.
كيف تعمل
- قم بتنزيل القالب: الحصول على وصول فوري إلى حاسبة Sanofins DCF المستندة إلى Excel.
- أدخل افتراضاتك: تعديل الخلايا ذات الضوء الصفراء لتحديد معدلات النمو ، WACC ، الهوامش ، والمعلمات الإضافية.
- الحسابات الفورية: يقوم النموذج على الفور بإعادة حساب القيمة الجوهرية لـ Sanofi India Limited.
- سيناريوهات الاختبار: تجربة الافتراضات المختلفة لتقييم التغييرات المحتملة في التقييم.
- تحليل وتحديد: الاستفادة من النتائج لإبلاغ استثمارك أو الاستراتيجيات المالية.
لماذا تختار هذه الآلة الحاسبة لـ Sanofi India Limited (Sanofins)؟
- دقة: يستخدم بيانات Sanofi المالية الفعلية لضمان الدقة.
- المرونة: تم تصميمه للسماح للمستخدمين بضبط واختبار مختلف المدخلات بسهولة.
- توفير الوقت: التخلص من الحاجة إلى إنشاء نموذج DCF من الألف إلى الياء.
- الدرجة المهنية: مصنوع بدقة على مستوى المدير المالي وسهولة الاستخدام في المقدمة.
- سهل الاستخدام: التصميم البديهي يجعله في متناول المستخدمين ذوي الخبرة النمذجة المالية المحدودة.
من يجب أن يستخدم هذا المنتج؟
- المستثمرون الأفراد: كسب رؤى لاتخاذ قرارات مستنيرة حول شراء أو بيع سهم Sanofi India Limited (Sanofins).
- المحللون الماليون: تعزيز سير عمل التقييم مع نماذج مالية يمكن الوصول إليها المصممة ل Sanofi India Limited (Sanofins).
- الاستشاريون: تزويد العملاء برؤى تقييم دقيقة وسريعة بشأن Sanofi India Limited (Sanofins).
- أصحاب الأعمال: تعرف على كيفية تقدير الشركات الكبرى مثل Sanofi India Limited (Sanofins) لإبلاغ استراتيجيات عملك الخاصة.
- طلاب التمويل: استكشاف منهجيات التقييم باستخدام بيانات العالم الحقيقي ودراسات الحالة المتعلقة بـ Sanofi India Limited (Sanofins).
محتويات القالب
- نموذج DCF مفصل: قالب قابل للتحرير يضم حسابات التقييم المتعمقة.
- البيانات ذات الصلة: تضمنت Sanofi India Limited (Sanofins) الماليات التاريخية والمتوقعة للتحليل الشامل.
- المعلمات المرنة: تعديل WACC ومعدلات النمو والافتراضات الضريبية لاستكشاف سيناريوهات مختلفة.
- البيانات المالية: انهيار سنوي وشامل ربع سنوي لاكتساب رؤى أعمق.
- النسب الرئيسية: تحليل متكامل للربحية والكفاءة والرافعة المالية.
- لوحة القيادة مع تمثيلات مرئية: الرسوم البيانية والجداول توفر رؤى واضحة وقابلة للتنفيذ.
Disclaimer
All information, articles, and product details provided on this website are for general informational and educational purposes only. We do not claim any ownership over, nor do we intend to infringe upon, any trademarks, copyrights, logos, brand names, or other intellectual property mentioned or depicted on this site. Such intellectual property remains the property of its respective owners, and any references here are made solely for identification or informational purposes, without implying any affiliation, endorsement, or partnership.
We make no representations or warranties, express or implied, regarding the accuracy, completeness, or suitability of any content or products presented. Nothing on this website should be construed as legal, tax, investment, financial, medical, or other professional advice. In addition, no part of this site—including articles or product references—constitutes a solicitation, recommendation, endorsement, advertisement, or offer to buy or sell any securities, franchises, or other financial instruments, particularly in jurisdictions where such activity would be unlawful.
All content is of a general nature and may not address the specific circumstances of any individual or entity. It is not a substitute for professional advice or services. Any actions you take based on the information provided here are strictly at your own risk. You accept full responsibility for any decisions or outcomes arising from your use of this website and agree to release us from any liability in connection with your use of, or reliance upon, the content or products found herein.