
|
Sanofi India Limited (Sanofi.NS) Évaluation DCF |
Entièrement Modifiable: Adapté À Vos Besoins Dans Excel Ou Sheets
Conception Professionnelle: Modèles Fiables Et Conformes Aux Normes Du Secteur
Pré-Construits Pour Une Utilisation Rapide Et Efficace
Compatible MAC/PC, entièrement débloqué
Aucune Expertise N'Est Requise; Facile À Suivre
Sanofi India Limited (SANOFI.NS) Bundle
Évaluez les perspectives financières de Sanofi India Limited comme un expert! Cette calculatrice (Sanofins) DCF offre des données financières pré-remplies et une pleine flexibilité pour modifier la croissance des revenus, le WACC, les marges et d'autres hypothèses cruciales pour s'aligner sur vos prévisions.
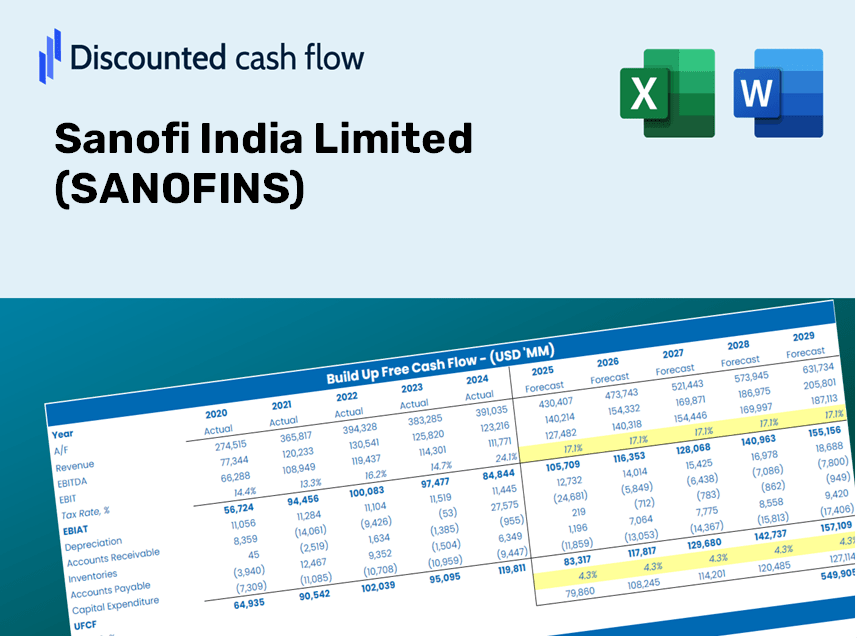
Discounted Cash Flow (DCF) - (USD MM)
| Year | AY1 2020 |
AY2 2021 |
AY3 2022 |
AY4 2023 |
AY5 2024 |
FY1 2025 |
FY2 2026 |
FY3 2027 |
FY4 2028 |
FY5 2029 |
|---|---|---|---|---|---|---|---|---|---|---|
| Revenue | 29,019.0 | 29,566.0 | 27,701.0 | 28,511.0 | 20,132.0 | 18,577.4 | 17,142.9 | 15,819.1 | 14,597.6 | 13,470.4 |
| Revenue Growth, % | 0 | 1.88 | -6.31 | 2.92 | -29.39 | -7.72 | -7.72 | -7.72 | -7.72 | -7.72 |
| EBITDA | 7,612.0 | 13,261.0 | 9,079.0 | 8,868.0 | 4,696.0 | 5,881.2 | 5,427.0 | 5,008.0 | 4,621.3 | 4,264.4 |
| EBITDA, % | 26.23 | 44.85 | 32.77 | 31.1 | 23.33 | 31.66 | 31.66 | 31.66 | 31.66 | 31.66 |
| Depreciation | 822.0 | 667.0 | 419.0 | 396.0 | 367.0 | 364.6 | 336.4 | 310.5 | 286.5 | 264.4 |
| Depreciation, % | 2.83 | 2.26 | 1.51 | 1.39 | 1.82 | 1.96 | 1.96 | 1.96 | 1.96 | 1.96 |
| EBIT | 6,790.0 | 12,594.0 | 8,660.0 | 8,472.0 | 4,329.0 | 5,516.6 | 5,090.6 | 4,697.5 | 4,334.8 | 4,000.0 |
| EBIT, % | 23.4 | 42.6 | 31.26 | 29.71 | 21.5 | 29.7 | 29.7 | 29.7 | 29.7 | 29.7 |
| Total Cash | 11,974.0 | 15,380.0 | 10,049.0 | 3,945.0 | 3,400.0 | 5,955.3 | 5,495.5 | 5,071.1 | 4,679.5 | 4,318.2 |
| Total Cash, percent | .0 | .0 | .0 | .0 | .0 | .0 | .0 | .0 | .0 | .0 |
| Account Receivables | 1,921.0 | 1,537.0 | 1,372.0 | 1,410.0 | 2,765.0 | 1,317.2 | 1,215.5 | 1,121.6 | 1,035.0 | 955.1 |
| Account Receivables, % | 6.62 | 5.2 | 4.95 | 4.95 | 13.73 | 7.09 | 7.09 | 7.09 | 7.09 | 7.09 |
| Inventories | 3,680.0 | 3,924.0 | 4,080.0 | 6,638.0 | 4,998.0 | 3,299.0 | 3,044.3 | 2,809.2 | 2,592.3 | 2,392.1 |
| Inventories, % | 12.68 | 13.27 | 14.73 | 23.28 | 24.83 | 17.76 | 17.76 | 17.76 | 17.76 | 17.76 |
| Accounts Payable | 3,183.0 | 3,767.0 | 3,564.0 | 2,915.0 | 4,063.0 | 2,488.7 | 2,296.5 | 2,119.2 | 1,955.5 | 1,804.5 |
| Accounts Payable, % | 10.97 | 12.74 | 12.87 | 10.22 | 20.18 | 13.4 | 13.4 | 13.4 | 13.4 | 13.4 |
| Capital Expenditure | -414.0 | -230.0 | -222.0 | -343.0 | -364.0 | -223.6 | -206.3 | -190.4 | -175.7 | -162.1 |
| Capital Expenditure, % | -1.43 | -0.77792 | -0.80142 | -1.2 | -1.81 | -1.2 | -1.2 | -1.2 | -1.2 | -1.2 |
| Tax Rate, % | 4.2 | 4.2 | 4.2 | 4.2 | 4.2 | 4.2 | 4.2 | 4.2 | 4.2 | 4.2 |
| EBITAT | 4,788.7 | 9,457.5 | 6,218.2 | 6,041.1 | 4,147.4 | 4,242.6 | 3,915.0 | 3,612.7 | 3,333.7 | 3,076.3 |
| Depreciation | ||||||||||
| Changes in Account Receivables | ||||||||||
| Changes in Inventories | ||||||||||
| Changes in Accounts Payable | ||||||||||
| Capital Expenditure | ||||||||||
| UFCF | 2,778.7 | 10,618.5 | 6,221.2 | 2,849.1 | 5,583.4 | 5,956.2 | 4,209.5 | 3,884.4 | 3,584.5 | 3,307.7 |
| WACC, % | 4.67 | 4.67 | 4.67 | 4.67 | 4.67 | 4.67 | 4.67 | 4.67 | 4.67 | 4.67 |
| PV UFCF | ||||||||||
| SUM PV UFCF | 18,540.8 | |||||||||
| Long Term Growth Rate, % | 3.00 | |||||||||
| Free cash flow (T + 1) | 3,407 | |||||||||
| Terminal Value | 204,459 | |||||||||
| Present Terminal Value | 162,769 | |||||||||
| Enterprise Value | 181,310 | |||||||||
| Net Debt | -2,645 | |||||||||
| Equity Value | 183,955 | |||||||||
| Diluted Shares Outstanding, MM | 23 | |||||||||
| Equity Value Per Share | 7,987.41 |
Benefits of Choosing Sanofi India Limited (SANOFINS)
- Accurate SANOFINS Financials: Access both historical and projected data for precise valuation.
- Customizable Parameters: Adjust WACC, tax rates, revenue growth, and capital expenditures to fit your analysis.
- Dynamic Calculations: Automated computation of intrinsic value and NPV in real-time.
- Scenario Analysis Tool: Evaluate various scenarios to forecast Sanofi India’s future performance.
- User-Friendly Interface: Designed for industry professionals while remaining easy to navigate for newcomers.
Key Features of Sanofi India Limited (SANOFINS)
- Customizable Forecast Variables: Adjust essential inputs such as revenue growth rates, EBITDA percentages, and capital expenditures.
- Instant DCF Valuation: Quickly calculates intrinsic value, net present value (NPV), and additional financial metrics.
- High-Precision Accuracy: Leverages Sanofi India Limited's actual financial data for credible valuation results.
- Simplified Scenario Analysis: Effortlessly explore various assumptions and evaluate their impacts.
- Efficiency Booster: Avoid the complexities of creating intricate valuation models from the ground up.
How It Functions
- Download the Template: Gain immediate access to the Excel-based SANOFINS DCF Calculator.
- Input Your Assumptions: Modify the yellow-highlighted cells to set growth rates, WACC, margins, and additional parameters.
- Instant Calculations: The model promptly recalculates the intrinsic value of Sanofi India Limited.
- Test Scenarios: Experiment with various assumptions to assess potential changes in valuation.
- Analyze and Decide: Utilize the outcomes to inform your investment or financial strategies.
Why Choose This Calculator for Sanofi India Limited (SANOFINS)?
- Accuracy: Utilizes actual Sanofi financial data to ensure precision.
- Flexibility: Built to allow users to easily adjust and test various inputs.
- Time-Saving: Eliminate the need to create a DCF model from the ground up.
- Professional-Grade: Crafted with CFO-level accuracy and ease of use at the forefront.
- User-Friendly: Intuitive design makes it accessible for users with limited financial modeling experience.
Who Should Utilize This Product?
- Individual Investors: Gain insights to make informed decisions about buying or selling Sanofi India Limited (SANOFINS) stock.
- Financial Analysts: Enhance valuation workflows with accessible financial models tailored for Sanofi India Limited (SANOFINS).
- Consultants: Provide clients with precise and prompt valuation insights regarding Sanofi India Limited (SANOFINS).
- Business Owners: Learn how major companies like Sanofi India Limited (SANOFINS) are valued to inform your own business strategies.
- Finance Students: Explore valuation methodologies using real-world data and case studies related to Sanofi India Limited (SANOFINS).
Contents of the Template
- Detailed DCF Model: An editable template featuring in-depth valuation calculations.
- Relevant Data: Sanofi India Limited's (SANOFINS) historical and projected financials included for thorough analysis.
- Flexible Parameters: Modify WACC, growth rates, and tax assumptions to explore different scenarios.
- Financial Statements: Comprehensive annual and quarterly breakdowns to gain deeper insights.
- Key Ratios: Integrated analysis for profitability, efficiency, and leverage metrics.
- Dashboard with Visual Representations: Graphs and tables providing clear, actionable insights.
Disclaimer
All information, articles, and product details provided on this website are for general informational and educational purposes only. We do not claim any ownership over, nor do we intend to infringe upon, any trademarks, copyrights, logos, brand names, or other intellectual property mentioned or depicted on this site. Such intellectual property remains the property of its respective owners, and any references here are made solely for identification or informational purposes, without implying any affiliation, endorsement, or partnership.
We make no representations or warranties, express or implied, regarding the accuracy, completeness, or suitability of any content or products presented. Nothing on this website should be construed as legal, tax, investment, financial, medical, or other professional advice. In addition, no part of this site—including articles or product references—constitutes a solicitation, recommendation, endorsement, advertisement, or offer to buy or sell any securities, franchises, or other financial instruments, particularly in jurisdictions where such activity would be unlawful.
All content is of a general nature and may not address the specific circumstances of any individual or entity. It is not a substitute for professional advice or services. Any actions you take based on the information provided here are strictly at your own risk. You accept full responsibility for any decisions or outcomes arising from your use of this website and agree to release us from any liability in connection with your use of, or reliance upon, the content or products found herein.