
|
شركة Seaboard Corporation (SEB) DCF |
Fully Editable: Tailor To Your Needs In Excel Or Sheets
Professional Design: Trusted, Industry-Standard Templates
Investor-Approved Valuation Models
MAC/PC Compatible, Fully Unlocked
No Expertise Is Needed; Easy To Follow
Seaboard Corporation (SEB) Bundle
استكشف التوقعات المالية لشركة Seaboard Corporation (SEB) باستخدام حاسبة DCF سهلة الاستخدام! أدخل توقعاتك للنمو والهوامش والنفقات لتحديد القيمة الجوهرية لشركة Seaboard Corporation (SEB) وصقل إستراتيجيتك الاستثمارية.
What You Will Receive
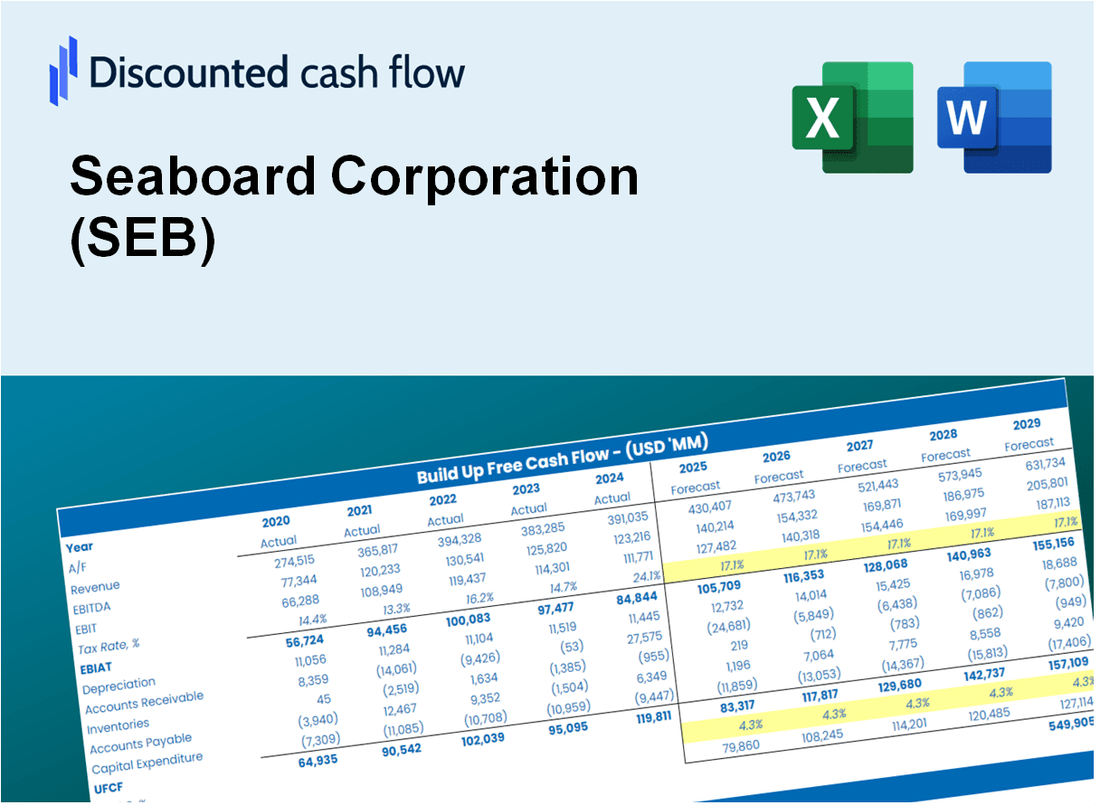
- Customizable Excel Template: A fully editable Excel-based DCF Calculator featuring pre-filled financial data for Seaboard Corporation (SEB).
- Real-World Insights: Access to historical data and future projections (highlighted in the yellow cells).
- Flexible Forecasting: Adjust forecast parameters such as revenue growth, EBITDA %, and WACC.
- Instant Calculations: Quickly observe how your inputs affect Seaboard Corporation’s (SEB) valuation.
- Professional Resource: Designed for investors, CFOs, consultants, and financial analysts.
- User-Friendly Interface: Organized for simplicity and ease of use, complete with step-by-step guidance.
Key Features
- Customizable Financial Inputs: Adjust essential parameters such as revenue projections, operating margin, and capital investment.
- Instant DCF Valuation: Provides immediate calculations for intrinsic value, net present value (NPV), and additional financial metrics.
- High-Precision Accuracy: Leverages Seaboard Corporation's (SEB) actual financial data for dependable valuation results.
- Effortless Scenario Modeling: Easily evaluate various assumptions and analyze different outcomes.
- Efficiency Booster: Streamlines the valuation process by removing the necessity to create intricate models from the ground up.
How It Works
- Step 1: Download the Excel file for Seaboard Corporation (SEB).
- Step 2: Review Seaboard's pre-filled financial data and forecasts.
- Step 3: Modify key inputs such as revenue growth, WACC, and tax rates (highlighted cells).
- Step 4: Observe the DCF model update in real-time as you adjust your assumptions.
- Step 5: Analyze the outputs and leverage the results for your investment decisions.
Why Choose Seaboard Corporation (SEB)?
- Industry Leader: Seaboard Corporation (SEB) is a recognized leader in food production and distribution.
- Commitment to Quality: Our products meet the highest standards of quality and safety.
- Innovative Solutions: We continuously invest in technology to enhance efficiency and sustainability.
- Global Reach: With operations in multiple countries, we provide a diverse range of products to meet customer needs.
- Expert Team: Our dedicated professionals bring extensive industry experience and knowledge.
Who Should Use This Product?
- Professional Investors: Develop comprehensive and trustworthy valuation models for analyzing Seaboard Corporation (SEB).
- Corporate Finance Teams: Evaluate valuation scenarios to inform strategic decisions within the organization.
- Consultants and Advisors: Deliver clients precise valuation insights related to Seaboard Corporation (SEB).
- Students and Educators: Utilize real-world data to enhance learning and practice in financial modeling.
- Agribusiness Enthusiasts: Gain insights into how companies like Seaboard Corporation (SEB) are valued in the agricultural sector.
What the Template Contains
- Operating and Balance Sheet Data: Pre-filled Seaboard Corporation (SEB) historical data and forecasts, including revenue, EBITDA, EBIT, and capital expenditures.
- WACC Calculation: A dedicated sheet for Weighted Average Cost of Capital (WACC), including parameters like Beta, risk-free rate, and share price.
- DCF Valuation (Unlevered and Levered): Editable Discounted Cash Flow models showing intrinsic value with detailed calculations.
- Financial Statements: Pre-loaded financial statements (annual and quarterly) to support analysis.
- Key Ratios: Includes profitability, leverage, and efficiency ratios for Seaboard Corporation (SEB).
- Dashboard and Charts: Visual summary of valuation outputs and assumptions to analyze results easily.
Disclaimer
All information, articles, and product details provided on this website are for general informational and educational purposes only. We do not claim any ownership over, nor do we intend to infringe upon, any trademarks, copyrights, logos, brand names, or other intellectual property mentioned or depicted on this site. Such intellectual property remains the property of its respective owners, and any references here are made solely for identification or informational purposes, without implying any affiliation, endorsement, or partnership.
We make no representations or warranties, express or implied, regarding the accuracy, completeness, or suitability of any content or products presented. Nothing on this website should be construed as legal, tax, investment, financial, medical, or other professional advice. In addition, no part of this site—including articles or product references—constitutes a solicitation, recommendation, endorsement, advertisement, or offer to buy or sell any securities, franchises, or other financial instruments, particularly in jurisdictions where such activity would be unlawful.
All content is of a general nature and may not address the specific circumstances of any individual or entity. It is not a substitute for professional advice or services. Any actions you take based on the information provided here are strictly at your own risk. You accept full responsibility for any decisions or outcomes arising from your use of this website and agree to release us from any liability in connection with your use of, or reliance upon, the content or products found herein.