
|
المصدر الأول (SRCE) تقييم DCF |
Fully Editable: Tailor To Your Needs In Excel Or Sheets
Professional Design: Trusted, Industry-Standard Templates
Investor-Approved Valuation Models
MAC/PC Compatible, Fully Unlocked
No Expertise Is Needed; Easy To Follow
1st Source Corporation (SRCE) Bundle
تبحث لتقييم القيمة الجوهرية لشركة المصدر الأول؟ يدمج حاسبة DCF (SRCE) DCF بيانات العالم الحقيقي مع ميزات تخصيص شاملة ، مما يتيح لك تخصيص توقعاتك وتعزيز اختيارات الاستثمار الخاصة بك.
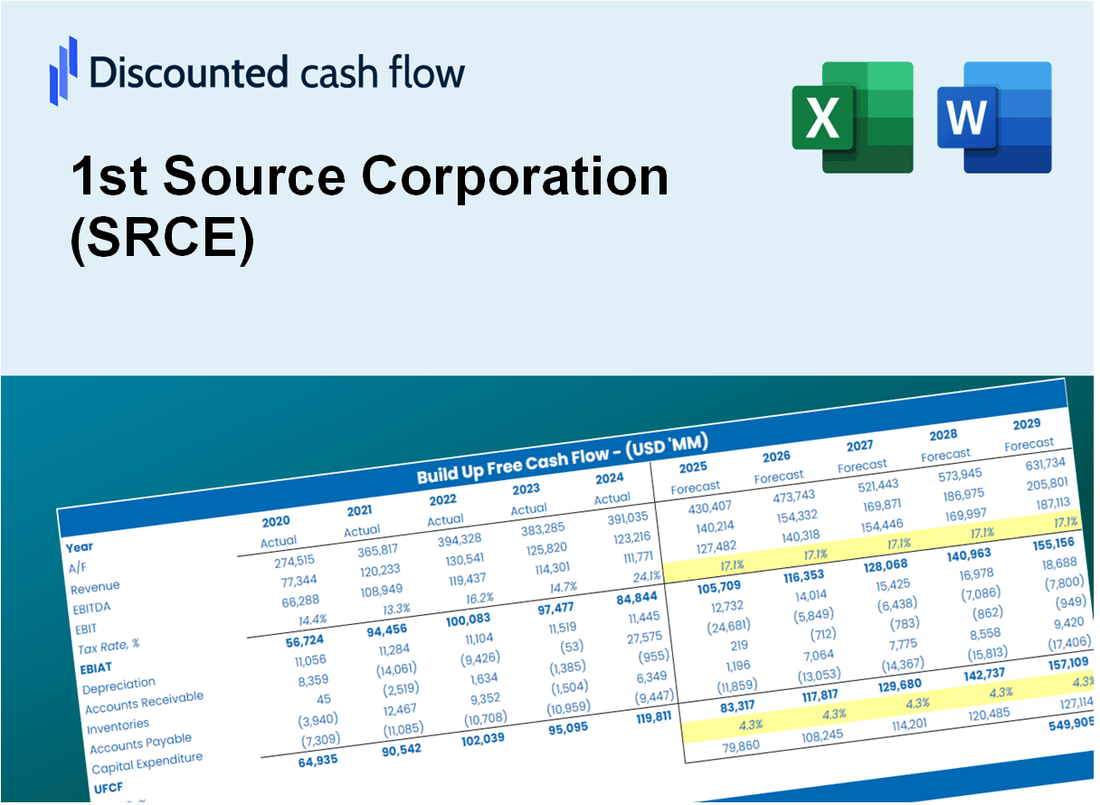
Discounted Cash Flow (DCF) - (USD MM)
| Year | AY1 2020 |
AY2 2021 |
AY3 2022 |
AY4 2023 |
AY5 2024 |
FY1 2025 |
FY2 2026 |
FY3 2027 |
FY4 2028 |
FY5 2029 |
|---|---|---|---|---|---|---|---|---|---|---|
| Revenue | 366.9 | 354.9 | 385.1 | 507.5 | 570.3 | 640.8 | 719.9 | 808.8 | 908.7 | 1,020.9 |
| Revenue Growth, % | 0 | -3.29 | 8.51 | 31.8 | 12.37 | 12.35 | 12.35 | 12.35 | 12.35 | 12.35 |
| EBITDA | 137.4 | 178.9 | 175.9 | 177.1 | 183.4 | 257.1 | 288.8 | 324.5 | 364.6 | 409.6 |
| EBITDA, % | 37.45 | 50.41 | 45.67 | 34.9 | 32.16 | 40.12 | 40.12 | 40.12 | 40.12 | 40.12 |
| Depreciation | 31.1 | 24.0 | 19.1 | 15.5 | 12.4 | 32.6 | 36.6 | 41.1 | 46.2 | 51.9 |
| Depreciation, % | 8.47 | 6.76 | 4.96 | 3.05 | 2.17 | 5.08 | 5.08 | 5.08 | 5.08 | 5.08 |
| EBIT | 106.3 | 154.9 | 156.8 | 161.7 | 171.1 | 224.5 | 252.2 | 283.4 | 318.4 | 357.7 |
| EBIT, % | 28.98 | 43.65 | 40.72 | 31.86 | 29.99 | 35.04 | 35.04 | 35.04 | 35.04 | 35.04 |
| Total Cash | 1,271.7 | 1,917.5 | 1,859.8 | 1,700.1 | 1,021.5 | 640.8 | 719.9 | 808.8 | 908.7 | 1,020.9 |
| Total Cash, percent | .0 | .0 | .0 | .0 | .0 | .0 | .0 | .0 | .0 | .0 |
| Account Receivables | 288.6 | 269.5 | 380.0 | .0 | .0 | 324.6 | 364.7 | 409.7 | 460.3 | 517.1 |
| Account Receivables, % | 78.65 | 75.94 | 98.68 | 0 | 0 | 50.65 | 50.65 | 50.65 | 50.65 | 50.65 |
| Inventories | .0 | .0 | .0 | .0 | .0 | .0 | .0 | .0 | .0 | .0 |
| Inventories, % | 0 | 0 | 0 | 0 | 0 | 0 | 0 | 0 | 0 | 0 |
| Accounts Payable | .0 | .0 | .0 | .0 | .0 | .0 | .0 | .0 | .0 | .0 |
| Accounts Payable, % | 0 | 0 | 0 | 0 | 0 | 0 | 0 | 0 | 0 | 0 |
| Capital Expenditure | -2.9 | -2.9 | -2.4 | -6.0 | -12.4 | -7.1 | -8.0 | -9.0 | -10.1 | -11.3 |
| Capital Expenditure, % | -0.77674 | -0.81327 | -0.61806 | -1.18 | -2.17 | -1.11 | -1.11 | -1.11 | -1.11 | -1.11 |
| Tax Rate, % | 22.47 | 22.47 | 22.47 | 22.47 | 22.47 | 22.47 | 22.47 | 22.47 | 22.47 | 22.47 |
| EBITAT | 81.4 | 118.5 | 120.5 | 124.9 | 132.6 | 172.8 | 194.1 | 218.1 | 245.0 | 275.3 |
| Depreciation | ||||||||||
| Changes in Account Receivables | ||||||||||
| Changes in Inventories | ||||||||||
| Changes in Accounts Payable | ||||||||||
| Capital Expenditure | ||||||||||
| UFCF | -178.9 | 158.8 | 26.7 | 514.4 | 132.6 | -126.4 | 182.6 | 205.2 | 230.5 | 259.0 |
| WACC, % | 13.28 | 13.27 | 13.31 | 13.35 | 13.37 | 13.31 | 13.31 | 13.31 | 13.31 | 13.31 |
| PV UFCF | ||||||||||
| SUM PV UFCF | 450.1 | |||||||||
| Long Term Growth Rate, % | 2.00 | |||||||||
| Free cash flow (T + 1) | 264 | |||||||||
| Terminal Value | 2,334 | |||||||||
| Present Terminal Value | 1,250 | |||||||||
| Enterprise Value | 1,700 | |||||||||
| Net Debt | 248 | |||||||||
| Equity Value | 1,451 | |||||||||
| Diluted Shares Outstanding, MM | 24 | |||||||||
| Equity Value Per Share | 59.25 |
What You Will Receive
- Customizable Excel Template: A fully editable Excel-based DCF Calculator featuring pre-filled real 1st Source Corporation (SRCE) financials.
- Authentic Data: Historical performance metrics and forward-looking projections (highlighted in the yellow cells).
- Flexible Forecasting: Adjust key assumptions such as revenue growth, EBITDA %, and WACC.
- Instant Calculations: Quickly observe how your inputs affect the valuation of 1st Source Corporation (SRCE).
- Professional Resource: Designed for investors, CFOs, consultants, and financial analysts.
- Intuitive Layout: Organized for simplicity and usability, complete with step-by-step guidance.
Key Features
- 🔍 Real-Life SRCE Financials: Pre-filled historical and projected data for 1st Source Corporation (SRCE).
- ✏️ Fully Customizable Inputs: Adjust all critical parameters (yellow cells) like WACC, growth %, and tax rates.
- 📊 Professional DCF Valuation: Built-in formulas calculate 1st Source Corporation’s intrinsic value using the Discounted Cash Flow method.
- ⚡ Instant Results: Visualize 1st Source Corporation’s valuation instantly after making changes.
- Scenario Analysis: Test and compare outcomes for various financial assumptions side-by-side.
How It Works
- Download: Obtain the pre-formatted Excel file containing 1st Source Corporation's (SRCE) financial data.
- Customize: Modify forecasts, such as revenue growth, EBITDA %, and WACC to fit your analysis.
- Update Automatically: Watch as intrinsic value and NPV calculations refresh in real-time.
- Test Scenarios: Generate various projections and instantly evaluate different outcomes.
- Make Decisions: Leverage the valuation insights to inform your investment approach.
Why Choose This Calculator for 1st Source Corporation (SRCE)?
- Designed for Experts: A sophisticated tool utilized by financial analysts, CFOs, and consultants.
- Accurate Financial Data: 1st Source Corporation’s historical and projected financials are preloaded for precision.
- Flexible Scenario Analysis: Easily simulate various forecasts and assumptions.
- Comprehensive Outputs: Automatically computes intrinsic value, NPV, and essential financial metrics.
- User-Friendly Interface: Step-by-step guidance ensures a smooth user experience.
Who Should Use 1st Source Corporation (SRCE)?
- Investors: Gain insights and make informed decisions with a reliable investment platform.
- Financial Analysts: Enhance your analysis with tailored reports and data-driven insights.
- Consultants: Utilize our resources to create impactful presentations for your clients.
- Finance Enthusiasts: Explore investment strategies and financial concepts through practical applications.
- Educators and Students: Leverage our tools for a hands-on approach to learning in finance courses.
What the Template Contains
- Pre-Filled Data: Includes 1st Source Corporation’s historical financials and projections.
- Discounted Cash Flow Model: Editable DCF valuation model with automatic calculations.
- Weighted Average Cost of Capital (WACC): A dedicated sheet for calculating WACC based on custom inputs.
- Key Financial Ratios: Analyze 1st Source Corporation’s profitability, efficiency, and leverage.
- Customizable Inputs: Edit revenue growth, margins, and tax rates with ease.
- Clear Dashboard: Charts and tables summarizing key valuation results.
Disclaimer
All information, articles, and product details provided on this website are for general informational and educational purposes only. We do not claim any ownership over, nor do we intend to infringe upon, any trademarks, copyrights, logos, brand names, or other intellectual property mentioned or depicted on this site. Such intellectual property remains the property of its respective owners, and any references here are made solely for identification or informational purposes, without implying any affiliation, endorsement, or partnership.
We make no representations or warranties, express or implied, regarding the accuracy, completeness, or suitability of any content or products presented. Nothing on this website should be construed as legal, tax, investment, financial, medical, or other professional advice. In addition, no part of this site—including articles or product references—constitutes a solicitation, recommendation, endorsement, advertisement, or offer to buy or sell any securities, franchises, or other financial instruments, particularly in jurisdictions where such activity would be unlawful.
All content is of a general nature and may not address the specific circumstances of any individual or entity. It is not a substitute for professional advice or services. Any actions you take based on the information provided here are strictly at your own risk. You accept full responsibility for any decisions or outcomes arising from your use of this website and agree to release us from any liability in connection with your use of, or reliance upon, the content or products found herein.