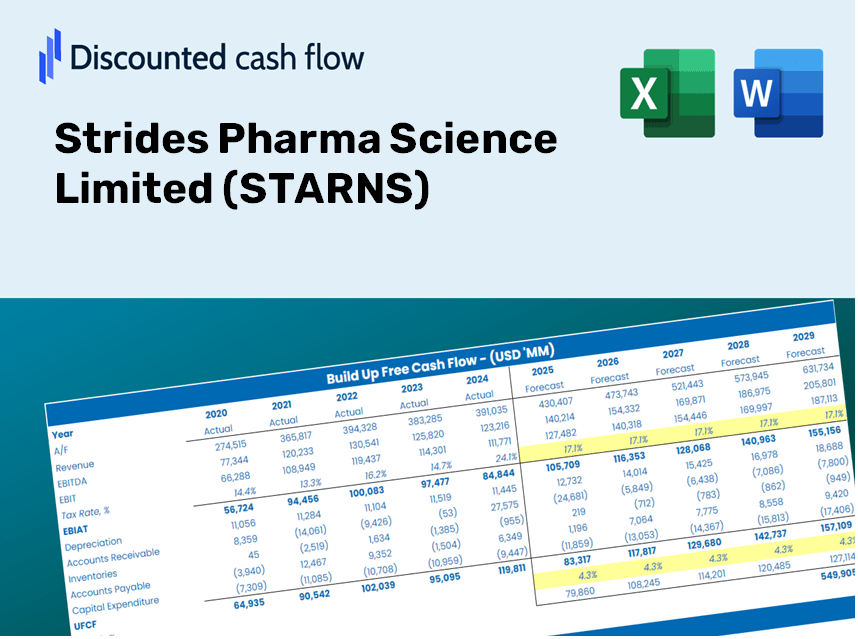
|
Strides Pharma Science Limited (Star.NS) تقييم DCF |

Fully Editable: Tailor To Your Needs In Excel Or Sheets
Professional Design: Trusted, Industry-Standard Templates
Investor-Approved Valuation Models
MAC/PC Compatible, Fully Unlocked
No Expertise Is Needed; Easy To Follow
Strides Pharma Science Limited (STAR.NS) Bundle
سواء كنت مستثمرًا أو محللًا ، فإن حاسبة DCF (Starns) هذه هي المورد الخاص بك للتقييم الدقيق. تم تحميلها مسبقًا ببيانات حقيقية من Strides Pharma Science Limited ، يمكنك ضبط التوقعات ومراقبة التأثيرات في الوقت الفعلي.
فوائد استخدام نموذجنا
- معلمات التنبؤ القابلة للتحرير: تعديل الافتراضات بسهولة (النمو ٪ ، الهوامش ، WACC) لإنشاء سيناريوهات مختلفة.
- بيانات السوق الشاملة: Strides Pharma Science Limited (Starns) البيانات المالية التي تم تحميلها مسبقًا لتسريع تحليلك.
- حسابات DCF الآلية: يوفر القالب صافي القيمة الحالية (NPV) وحسابات القيمة الجوهرية تلقائيًا.
- التصميم القابل للتخصيص والمهني: نموذج Excel المكرر الذي يلبي متطلبات التقييم الخاصة بك.
- مصمم للمحللين والمستثمرين: مثالي لاختبار التنبؤات ، والتحقق من الاستراتيجيات ، وتوفير الوقت الثمين.
الميزات الرئيسية
- بيانات STARNS الشاملة: يتضمن البيانات المالية التاريخية لشركة Strides Pharma Science Limited والتوقعات المستقبلية.
- خيارات الإدخال المرنة: تعديل المعايير مثل معدلات نمو الإيرادات وهوامش الربح و WACC ومعدلات الضرائب والنفقات الرأسمالية.
- نموذج التقييم التكيفي: يقوم تلقائيًا بتحديث صافي القيمة الحالية (NPV) والقيمة الجوهرية بناءً على التعديلات الخاصة بك.
- تحليل السيناريو: وضع سيناريوهات مختلفة للتنبؤ لتقييم نتائج التقييم المختلفة.
- واجهة بديهية: مصممة لتكون مباشرة ويمكن الوصول إليها لكل من المحترفين والوافدين الجدد.
كيف تعمل
- الخطوة 1: قم بتنزيل ملف Excel.
- الخطوة 2: مراجعة Strides Pharma Science Limited (Starns) البيانات المالية المليئة مسبقًا وتوقعاتها.
- الخطوة 3: ضبط المدخلات الرئيسية مثل نمو الإيرادات ، WACC ، ومعدلات الضرائب (الخلايا المميزة).
- الخطوة 4: راقب تحديث نموذج DCF في الوقت الفعلي أثناء تعديل افتراضاتك.
- الخطوة 5: تقييم المخرجات واستخدم النتائج لقرارات الاستثمار الخاصة بك.
لماذا تختار حاسبةنا لـ Strides Pharma Science Limited (Starns)؟
- دقة: يستخدم البيانات المالية الحقيقية من Strides Pharma لدقة لا مثيل لها.
- القدرة على التكيف: صُنعت للسماح للمستخدمين بضبط واختبار مختلف المدخلات.
- كفاءة: تجنب تعقيدات إنشاء نموذج تدفق نقدي مخفض من الألف إلى الياء.
- مستوى الخبراء: تم تصميمه بدقة وسهولة الاستخدام على مستوى المدير المالي.
- حدسي: بسيط للتنقل ، مناسب للأفراد دون خبرة نماذج مالية واسعة النطاق.
من يمكنه الاستفادة من هذا المنتج؟
- المستثمرون: تقييم بدقة القيمة العادلة لـ Strides Pharma Science Limited (Starns) قبل اتخاذ خيارات الاستثمار.
- المدير المالي: الاستفادة من نموذج DCF عالي الجودة للتقارير المالية والتحليل الاستراتيجي.
- الاستشاريون: تخصيص القالب بسهولة لتقارير تقييم العميل.
- رواد الأعمال: اكتساب رؤى حول ممارسات النمذجة المالية التي تستخدمها الشركات الصيدلانية الرائدة.
- المعلمون: توظيفها كمورد تعليمي لتوضيح تقنيات التقييم.
ما يحتويه القالب
- نموذج DCF المليء مسبقًا: Strides Pharma Science Limited's (Starns) البيانات المالية المسبق للاستخدام الفوري.
- حاسبة WACC: الحسابات التفصيلية لمتوسط تكلفة رأس المال المرجح لـ (Starns).
- النسب المالية: تقييم (Starns) "الربحية والرافعة المالية والكفاءة.
- مدخلات قابلة للتحرير: تعديل الافتراضات مثل معدلات النمو والهوامش و Capex لتكييف تحليلك.
- البيانات المالية: الوصول إلى التقارير السنوية والفصلية للتقييم الشامل.
- لوحة القيادة التفاعلية: تصور دون عناء مقاييس التقييم الأساسية والنتائج لـ (Starns).
Disclaimer
All information, articles, and product details provided on this website are for general informational and educational purposes only. We do not claim any ownership over, nor do we intend to infringe upon, any trademarks, copyrights, logos, brand names, or other intellectual property mentioned or depicted on this site. Such intellectual property remains the property of its respective owners, and any references here are made solely for identification or informational purposes, without implying any affiliation, endorsement, or partnership.
We make no representations or warranties, express or implied, regarding the accuracy, completeness, or suitability of any content or products presented. Nothing on this website should be construed as legal, tax, investment, financial, medical, or other professional advice. In addition, no part of this site—including articles or product references—constitutes a solicitation, recommendation, endorsement, advertisement, or offer to buy or sell any securities, franchises, or other financial instruments, particularly in jurisdictions where such activity would be unlawful.
All content is of a general nature and may not address the specific circumstances of any individual or entity. It is not a substitute for professional advice or services. Any actions you take based on the information provided here are strictly at your own risk. You accept full responsibility for any decisions or outcomes arising from your use of this website and agree to release us from any liability in connection with your use of, or reliance upon, the content or products found herein.
