
|
STRIDES PHARMA SCIENCE LIMITED (STAR.NS) Évaluation DCF |
Entièrement Modifiable: Adapté À Vos Besoins Dans Excel Ou Sheets
Conception Professionnelle: Modèles Fiables Et Conformes Aux Normes Du Secteur
Pré-Construits Pour Une Utilisation Rapide Et Efficace
Compatible MAC/PC, entièrement débloqué
Aucune Expertise N'Est Requise; Facile À Suivre
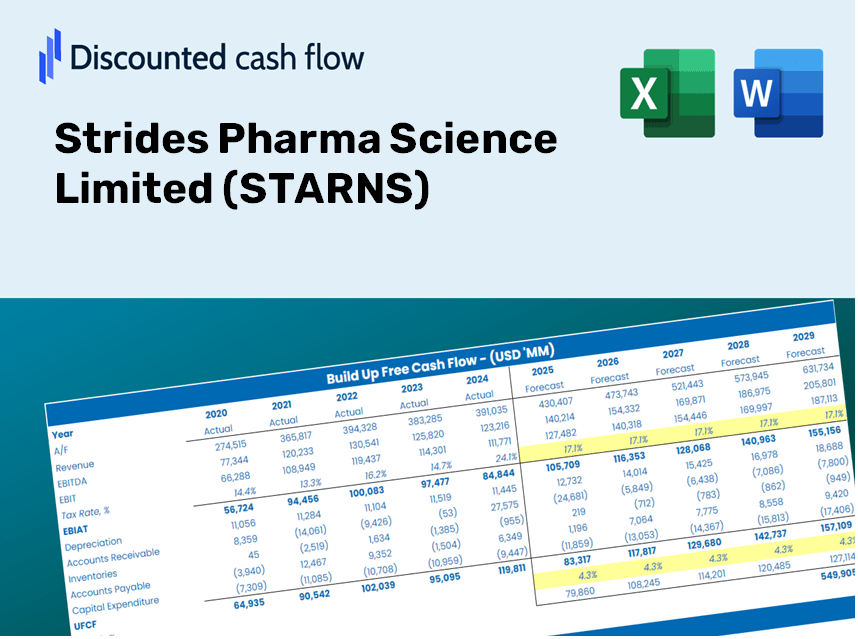
Strides Pharma Science Limited (STAR.NS) Bundle
Que vous soyez un investisseur ou un analyste, cette calculatrice DCF (Starns) est votre ressource incontournable pour une évaluation précise. Préchargé avec des données réelles de Strides Pharma Science Limited, vous pouvez ajuster les prévisions et observer les effets en temps réel.
Benefits of Using Our Model
- Editable Forecast Parameters: Easily adjust assumptions (growth %, margins, WACC) to generate various scenarios.
- Comprehensive Market Data: Strides Pharma Science Limited (STARNS) financial data pre-loaded to accelerate your analysis.
- Automated DCF Calculations: The template provides Net Present Value (NPV) and intrinsic value calculations automatically.
- Customizable and Professional Design: A refined Excel model that meets your valuation requirements.
- Designed for Analysts and Investors: Perfect for testing forecasts, validating strategies, and saving valuable time.
Key Features
- Comprehensive STARNS Data: Includes Strides Pharma Science Limited's historical financials and future projections.
- Flexible Input Options: Modify parameters such as revenue growth rates, profit margins, WACC, tax rates, and capital expenditures.
- Adaptive Valuation Model: Automatically refreshes Net Present Value (NPV) and intrinsic value based on your adjustments.
- Scenario Analysis: Develop various forecasting scenarios to evaluate different valuation results.
- Intuitive Interface: Designed to be straightforward and accessible for both professionals and newcomers.
How It Works
- Step 1: Download the Excel file.
- Step 2: Review Strides Pharma Science Limited's (STARNS) pre-filled financial data and forecasts.
- Step 3: Adjust key inputs such as revenue growth, WACC, and tax rates (highlighted cells).
- Step 4: Observe the DCF model update in real-time as you modify your assumptions.
- Step 5: Evaluate the outputs and utilize the findings for your investment decisions.
Why Opt for Our Calculator for Strides Pharma Science Limited (STARNS)?
- Precision: Utilizes real financial data from Strides Pharma for unparalleled accuracy.
- Adaptability: Crafted to allow users to freely adjust and test various inputs.
- Efficiency: Avoid the complexities of creating a discounted cash flow model from the ground up.
- Expert-Level: Designed with the precision and usability expected at the CFO level.
- Intuitive: Simple to navigate, suitable for individuals without extensive financial modeling expertise.
Who Can Benefit from This Product?
- Investors: Accurately assess the fair value of Strides Pharma Science Limited (STARNS) before making investment choices.
- CFOs: Utilize a high-quality DCF model for financial reporting and strategic analysis.
- Consultants: Easily customize the template for client valuation reports.
- Entrepreneurs: Acquire insights into financial modeling practices used by leading pharmaceutical firms.
- Educators: Employ it as a teaching resource to illustrate valuation techniques.
What the Template Contains
- Pre-Filled DCF Model: Strides Pharma Science Limited's (STARNS) financial data preloaded for immediate use.
- WACC Calculator: Detailed calculations for Weighted Average Cost of Capital specific to (STARNS).
- Financial Ratios: Assess (STARNS)' profitability, leverage, and efficiency metrics.
- Editable Inputs: Modify assumptions such as growth rates, margins, and CAPEX to tailor your analysis.
- Financial Statements: Access annual and quarterly reports for comprehensive evaluation.
- Interactive Dashboard: Effortlessly visualize essential valuation metrics and outcomes for (STARNS).
Disclaimer
All information, articles, and product details provided on this website are for general informational and educational purposes only. We do not claim any ownership over, nor do we intend to infringe upon, any trademarks, copyrights, logos, brand names, or other intellectual property mentioned or depicted on this site. Such intellectual property remains the property of its respective owners, and any references here are made solely for identification or informational purposes, without implying any affiliation, endorsement, or partnership.
We make no representations or warranties, express or implied, regarding the accuracy, completeness, or suitability of any content or products presented. Nothing on this website should be construed as legal, tax, investment, financial, medical, or other professional advice. In addition, no part of this site—including articles or product references—constitutes a solicitation, recommendation, endorsement, advertisement, or offer to buy or sell any securities, franchises, or other financial instruments, particularly in jurisdictions where such activity would be unlawful.
All content is of a general nature and may not address the specific circumstances of any individual or entity. It is not a substitute for professional advice or services. Any actions you take based on the information provided here are strictly at your own risk. You accept full responsibility for any decisions or outcomes arising from your use of this website and agree to release us from any liability in connection with your use of, or reliance upon, the content or products found herein.