
|
Sun Pharmaceutical Industries Limited (Sunpharma.ns) تقييم DCF |
Fully Editable: Tailor To Your Needs In Excel Or Sheets
Professional Design: Trusted, Industry-Standard Templates
Investor-Approved Valuation Models
MAC/PC Compatible, Fully Unlocked
No Expertise Is Needed; Easy To Follow
Sun Pharmaceutical Industries Limited (SUNPHARMA.NS) Bundle
استكشف الآفاق المالية لصناعات Sun Pharmaceutical Industries Limited (SunPharmans) مع حاسبة DCF سهلة الاستخدام! أدخل افتراضاتك عن معدلات النمو ، وهوامش الربح ، ونفقات حساب القيمة الجوهرية لصناعات Sun Pharmaceutical Limited (SunPharmans) وتحسين استراتيجيتك الاستثمارية.
ما ستناله
- البيانات المالية: يوفر بيانات تاريخية ومسقطة للتقييم الدقيق.
- المدخلات القابلة للتخصيص: قم بتعديل WACC ومعدلات الضرائب ونمو الإيرادات والنفقات الرأسمالية حسب الحاجة.
- الحسابات الآلية: يتم حساب القيمة الجوهرية و NPV في الوقت الفعلي.
- تحليل السيناريو: استكشف سيناريوهات مختلفة لتقييم الأداء المستقبلي لشركة Sun Pharmaceutical Industries.
- تصميم واضح وسهل الاستخدام: مصمم للخبراء مع البقاء في متناول الوافدين الجدد.
الميزات الرئيسية
- 🔍 Real-Life SUNPHARMANS المالية: بيانات تاريخية ومسقطة مأهولة مسبقًا لشركة Sun Pharmaceutical Industries Limited.
- ✏• المدخلات القابلة للتخصيص بالكامل: تعديل جميع المعلمات الأساسية (الخلايا الصفراء) مثل WACC، والنمو٪، ومعدلات الضرائب.
- 📊 تقييم DCF المهني: تحسب الصيغ المتكاملة القيمة الجوهرية لشركة Sun Pharmaceutical Industries باستخدام نهج التدفق النقدي المخفض.
- ⚡ النتائج الفورية: عرض تقييم Sun Pharmaceutical فور إجراء التعديلات.
- تحليل السيناريو: تقييم وتباين نتائج الافتراضات المالية المختلفة جنبا إلى جنب.
كيف تعمل
- 1. الوصول إلى القالب: قم بتنزيل ملف Excel وفتحه يحتوي على بيانات Sun Pharmaceutical Industries Limited (SunPharmans).
- 2. ضبط الافتراضات: تعديل المدخلات الأساسية مثل معدلات النمو ، WACC ، والنفقات الرأسمالية.
- 3. عرض النتائج الفورية: يقوم نموذج DCF تلقائيًا بحساب القيمة الجوهرية و NPV.
- 4. استكشاف السيناريوهات: تحليل التنبؤات المختلفة لتقييم إمكانيات التقييم المختلفة.
- 5. الحاضر بثقة: تقديم رؤى تقييم احترافية لتعزيز اتخاذ القرار.
لماذا تختار حاسبة صناعات Sun Pharmaceutical Industries Limited (SunPharmans)؟
- وفر الوقت: القفز مباشرة مع طراز DCF مصمم مسبقًا-لا يوجد إعداد أولي مطلوب.
- تعزيز الدقة: الوصول إلى البيانات المالية التي يمكن الاعتماد عليها وصيغها لتقليل أخطاء التقييم.
- قابلة للتخصيص تماما: اضبط النموذج لتناسب افتراضاتك الفريدة وتوقعاتك.
- سهل الاستخدام: المخططات والمخرجات البديهية تبسيط تفسير النتائج.
- يفضله المهنيون: صُنعت للخبراء الذين يعطون الأولوية للدقة والوظائف.
من الذي يمكن أن يستفيد من صناعات Sun Pharmaceutical Limited (Sunpharmans)؟
- المستثمرون: اتخاذ قرارات مستنيرة مع أدوات التقييم الشاملة لدينا.
- المحللون الماليون: قم بتبسيط عملك مع نموذج DCF القابل للتخصيص المصمم خصيصًا لسهولة الاستخدام.
- الاستشاريون: تعديل القالب دون عناء لعروض العميل أو التقارير التفصيلية.
- عشاق الأدوية: عزز معرفتك باستراتيجيات التقييم مع أمثلة صناعة الحياة الواقعية.
- المعلمون والطلاب: الاستفادة من هذا المورد كمساعدات عملية في دورات التمويل الصيدلانية.
ما يتضمنه القالب
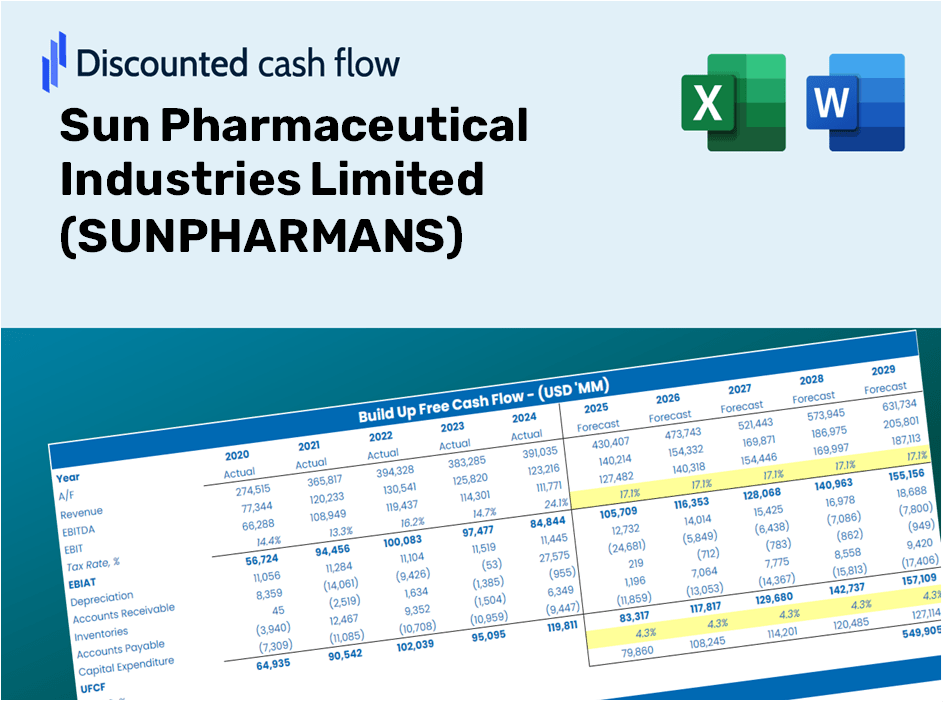
- بيانات SunPharmans المسبقة: المقاييس المالية التاريخية والمتوقعة ، والتي تشمل الإيرادات ، والوزارة الداخلية ، والنفقات الرأسمالية.
- نماذج DCF و WACC: قوالب عالية الجودة لتحديد القيمة الجوهرية ومتوسط تكلفة رأس المال المرجح.
- مدخلات قابلة للتحرير: الحقول ذات الضوء الصفراء لتعديل نمو الإيرادات ومعدلات الضرائب ومعدلات الخصم.
- البيانات المالية: تقارير مالية سنوية وفصلية مفصلة للتحليل الشامل.
- النسب الرئيسية: مقاييس حول الربحية والرافعة المالية والكفاءة لتقييم الأداء العام.
- لوحة القيادة والمخططات: التمثيل المرئي لنتائج التقييم والافتراضات الأساسية.
Disclaimer
All information, articles, and product details provided on this website are for general informational and educational purposes only. We do not claim any ownership over, nor do we intend to infringe upon, any trademarks, copyrights, logos, brand names, or other intellectual property mentioned or depicted on this site. Such intellectual property remains the property of its respective owners, and any references here are made solely for identification or informational purposes, without implying any affiliation, endorsement, or partnership.
We make no representations or warranties, express or implied, regarding the accuracy, completeness, or suitability of any content or products presented. Nothing on this website should be construed as legal, tax, investment, financial, medical, or other professional advice. In addition, no part of this site—including articles or product references—constitutes a solicitation, recommendation, endorsement, advertisement, or offer to buy or sell any securities, franchises, or other financial instruments, particularly in jurisdictions where such activity would be unlawful.
All content is of a general nature and may not address the specific circumstances of any individual or entity. It is not a substitute for professional advice or services. Any actions you take based on the information provided here are strictly at your own risk. You accept full responsibility for any decisions or outcomes arising from your use of this website and agree to release us from any liability in connection with your use of, or reliance upon, the content or products found herein.