
|
Sun Pharmaceutical Industries Limited (Sunpharma.NS) Valoración de DCF |
Completamente Editable: Adáptelo A Sus Necesidades En Excel O Sheets
Diseño Profesional: Plantillas Confiables Y Estándares De La Industria
Predeterminadas Para Un Uso Rápido Y Eficiente
Compatible con MAC / PC, completamente desbloqueado
No Se Necesita Experiencia; Fáciles De Seguir
Sun Pharmaceutical Industries Limited (SUNPHARMA.NS) Bundle
¡Explore las perspectivas financieras de Sun Pharmaceutical Industries Limited (SunPharmans) con nuestra calculadora DCF fácil de usar! Ingrese sus suposiciones para las tasas de crecimiento, los márgenes de beneficio y los gastos para calcular el valor intrínseco de Sun Pharmaceutical Industries Limited (SunPharmans) y refinar su estrategia de inversión.
What You Will Receive
- Actual SUNPHARMANS Financials: Provides both historical and projected data for precise valuation.
- Customizable Inputs: Adjust WACC, tax rates, revenue growth, and capital expenditures as needed.
- Automated Calculations: Intrinsic value and NPV are computed in real-time.
- Scenario Analysis: Explore various scenarios to assess the future performance of Sun Pharmaceutical Industries.
- Clear and User-Friendly Design: Designed for experts while remaining accessible to newcomers.
Key Features
- 🔍 Real-Life SUNPHARMANS Financials: Pre-populated historical and projected data for Sun Pharmaceutical Industries Limited.
- ✏️ Fully Customizable Inputs: Modify all essential parameters (yellow cells) such as WACC, growth %, and tax rates.
- 📊 Professional DCF Valuation: Integrated formulas compute the intrinsic value of Sun Pharmaceutical Industries using the Discounted Cash Flow approach.
- ⚡ Instant Results: View Sun Pharmaceutical’s valuation immediately after making adjustments.
- Scenario Analysis: Evaluate and contrast results for different financial assumptions side-by-side.
How It Works
- 1. Access the Template: Download and open the Excel file containing Sun Pharmaceutical Industries Limited’s (SUNPHARMANS) preloaded data.
- 2. Adjust Assumptions: Modify essential inputs such as growth rates, WACC, and capital expenditures.
- 3. View Immediate Results: The DCF model automatically computes intrinsic value and NPV.
- 4. Explore Scenarios: Analyze various forecasts to evaluate different valuation possibilities.
- 5. Present with Confidence: Deliver professional valuation insights to enhance your decision-making.
Why Opt for the Sun Pharmaceutical Industries Limited (SUNPHARMANS) Calculator?
- Save Time: Jump straight in with a pre-built DCF model – no initial setup required.
- Enhance Accuracy: Access dependable financial data and formulas to minimize valuation mistakes.
- Completely Customizable: Adjust the model to fit your unique assumptions and forecasts.
- User-Friendly: Intuitive charts and outputs simplify result interpretation.
- Preferred by Professionals: Crafted for experts who prioritize precision and functionality.
Who Can Benefit from SUN Pharmaceutical Industries Limited (SUNPHARMANS)?
- Investors: Make informed decisions with our comprehensive valuation tools.
- Financial Analysts: Streamline your work with our customizable DCF model tailored for ease of use.
- Consultants: Effortlessly modify the template for client presentations or detailed reports.
- Pharmaceutical Enthusiasts: Enhance your knowledge of valuation strategies with real-life industry examples.
- Educators and Students: Utilize this resource as a practical aid in pharmaceutical finance courses.
What the Template Includes
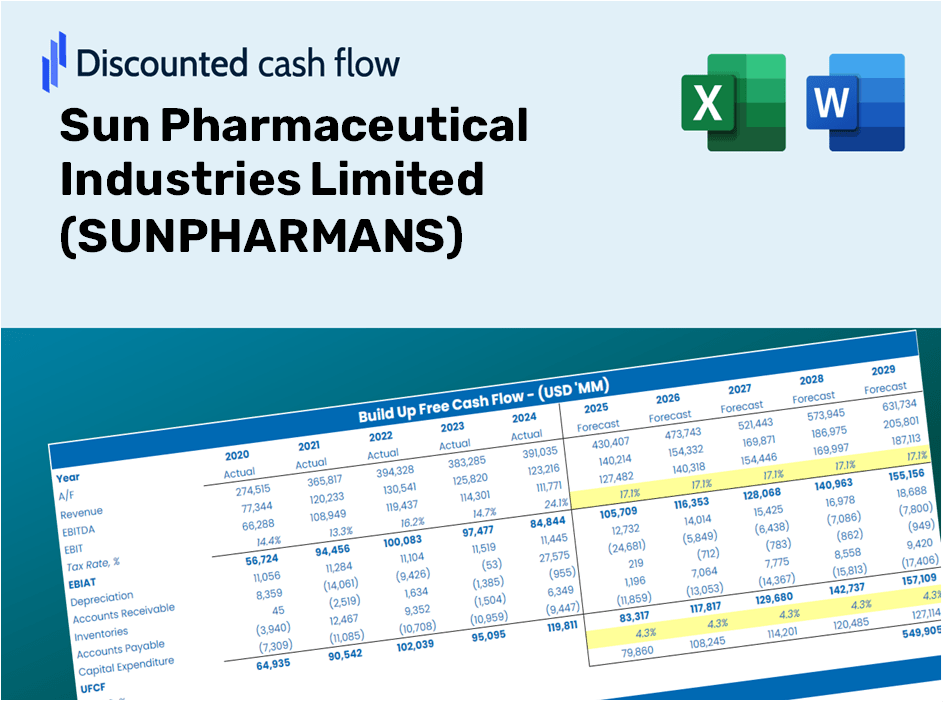
- Preloaded SUNPHARMANS Data: Historical and forecasted financial metrics, encompassing revenue, EBIT, and capital expenditures.
- DCF and WACC Models: High-quality templates for determining intrinsic value and Weighted Average Cost of Capital.
- Editable Inputs: Yellow-highlighted fields for modifying revenue growth, tax rates, and discount rates.
- Financial Statements: Detailed annual and quarterly financial reports for thorough analysis.
- Key Ratios: Metrics on profitability, leverage, and efficiency to assess overall performance.
- Dashboard and Charts: Visual representations of valuation results and underlying assumptions.
Disclaimer
All information, articles, and product details provided on this website are for general informational and educational purposes only. We do not claim any ownership over, nor do we intend to infringe upon, any trademarks, copyrights, logos, brand names, or other intellectual property mentioned or depicted on this site. Such intellectual property remains the property of its respective owners, and any references here are made solely for identification or informational purposes, without implying any affiliation, endorsement, or partnership.
We make no representations or warranties, express or implied, regarding the accuracy, completeness, or suitability of any content or products presented. Nothing on this website should be construed as legal, tax, investment, financial, medical, or other professional advice. In addition, no part of this site—including articles or product references—constitutes a solicitation, recommendation, endorsement, advertisement, or offer to buy or sell any securities, franchises, or other financial instruments, particularly in jurisdictions where such activity would be unlawful.
All content is of a general nature and may not address the specific circumstances of any individual or entity. It is not a substitute for professional advice or services. Any actions you take based on the information provided here are strictly at your own risk. You accept full responsibility for any decisions or outcomes arising from your use of this website and agree to release us from any liability in connection with your use of, or reliance upon, the content or products found herein.